Org Charts | Ownership | Tesla

Elon Musk Tesla Twitter Ownership Chart

Elon Musk Tesla, Twitter, SpaceX Ownership Structure

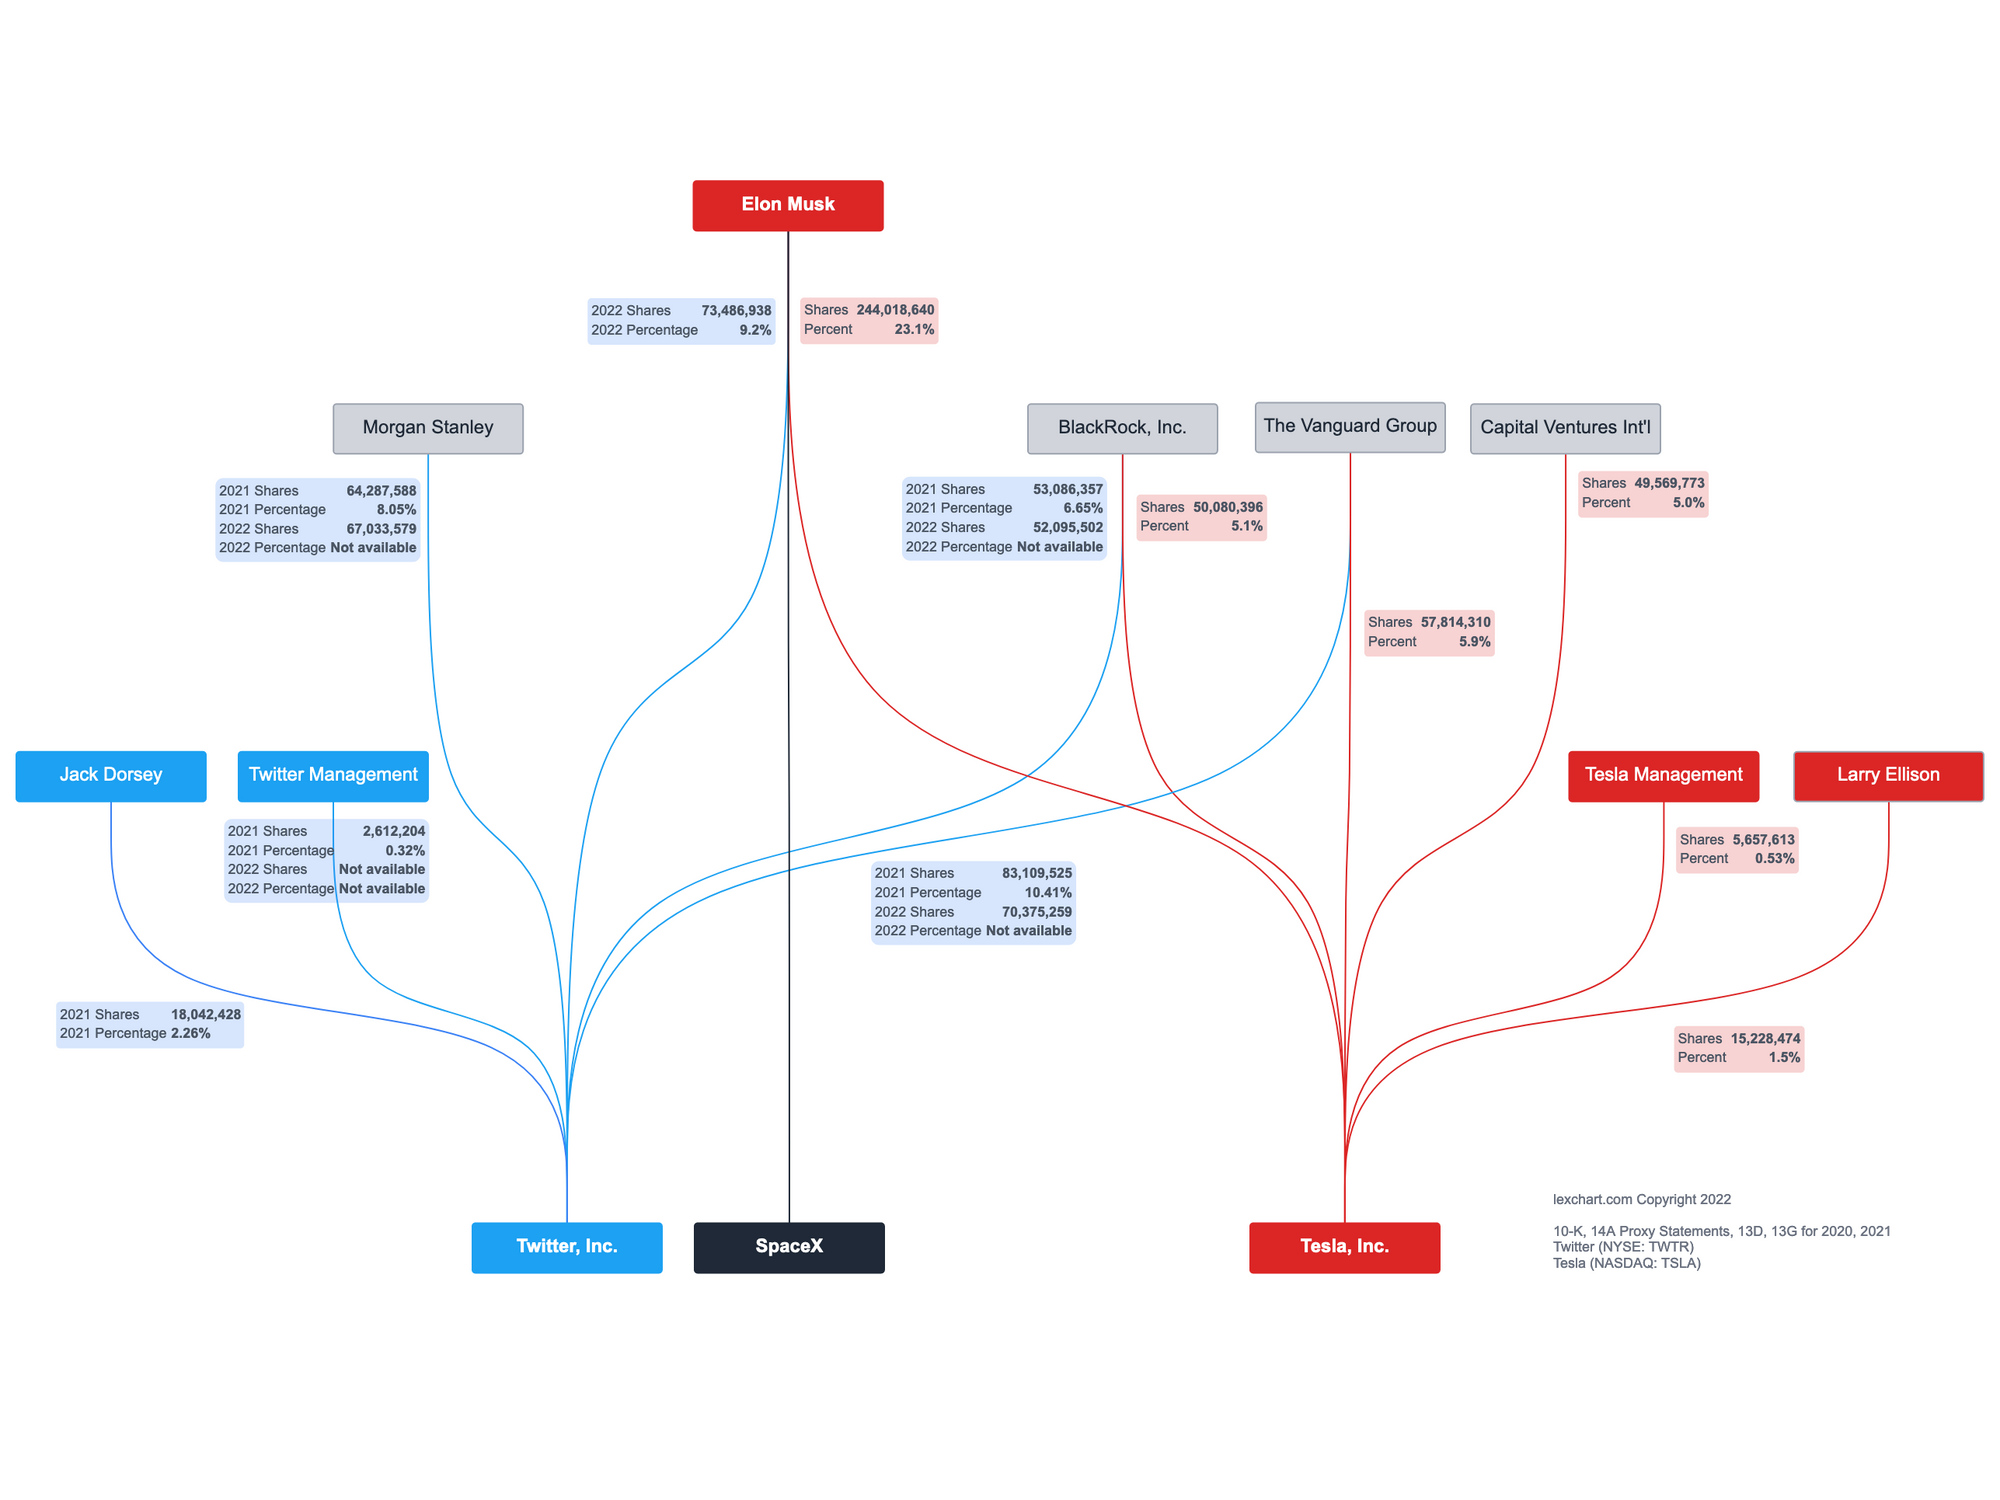
This ownership chart for Twitter (NYSE: TWTR) and Tesla (NASDAQ: TSLA) shows the beneficial owners as of the date of the source filings. This company ownership chart features Elon Musk after the announcement of his acquisition Twitter shares in 2022.

The company chart reveals the ownership shares and percentages for the following outside investors:

  • The Vanguard Group,
  • BlackRock, Inc.,
  • Capital Ventures International, and
  • Morgan Stanley.
Tesla, Inc. SpaceX Tesla Management Capital Ventures Int'l BlackRock, Inc. Larry Ellison Twitter, Inc. Morgan Stanley Elon Musk Twitter Management Jack Dorsey The Vanguard Group 2021 Shares 53,086,357 2021 Percentage 6.65% 2022 Shares 52,095,502 2022 Percentage Not available 2021 Shares 2,612,204 2021 Percentage 0.32% 2022 Shares Not available 2022 Percentage Not available Shares 50,080,396 Percent 5.1% Shares 49,569,773 Percent 5.0% 2021 Shares 83,109,525 2021 Percentage 10.41% 2022 Shares 70,375,259 2022 Percentage Not available Shares 5,657,613 Percent 0.53% Shares 15,228,474 Percent 1.5% 2022 Shares 73,486,938 2022 Percentage 9.2% Shares 57,814,310 Percent 5.9% 2021 Shares 64,287,588 2021 Percentage 8.05% 2022 Shares 67,033,579 2022 Percentage Not available Shares 244,018,640 Percent 23.1% 2021 Shares 18,042,428 2021 Percentage ​2.26% lexchart.com Copyright 2022 10-K, 14A Proxy Statements, 13D, 13G for 2020, 2021 Twitter (NYSE: TWTR) Tesla (NASDAQ: TSLA)

The ownership stake of Tesla's Officers and Directors appears on the chart. Larry Ellison, however, appears as a separate item on the chart, since his ownership stake in Tesla exceeds 1%.

The ownership stake of Twitter's Officers and Directors appears on the chart. Jack Dorsey appears as a separate item on the chart. His ownership stake in Twitter exceeded 2% in 2020.

The Twitter elements on the chart show the beneficial owners based on the Schedule 14A Proxy Statement filed for 2021 and the PRE 14A Proxy Statement draft filed for 2022 as of the date of this article. The draft proxy omitted some data for shares and percentages for 2022. The chart shows the values from both the 2021 and 2022 Proxy Statements.

Sign up for our newsletter

Receive occasional updates on all things hierarchy charts.

Enter your email
Subscribe