

The Ultimate Guide to Company Structure Charts

What is a company structure chart?
Definition of company structure chart
A company structure chart is a visualization of the ownership, governance, and management relationships among legal entities of a single enterprise (a collection of companies).
Company structure chart and company hierarchy chart are synonyms. As I discuss later, hierarchy is essential to certain company structure charts.
Types of company structure charts
There are three types of company hierarchy charts:
- company ownership charts,
- governance charts, and
- management charts.
A company ownership chart shows the financial and voting interests, among other attributes, for an enterprise. The types of legal entities on the chart are important.
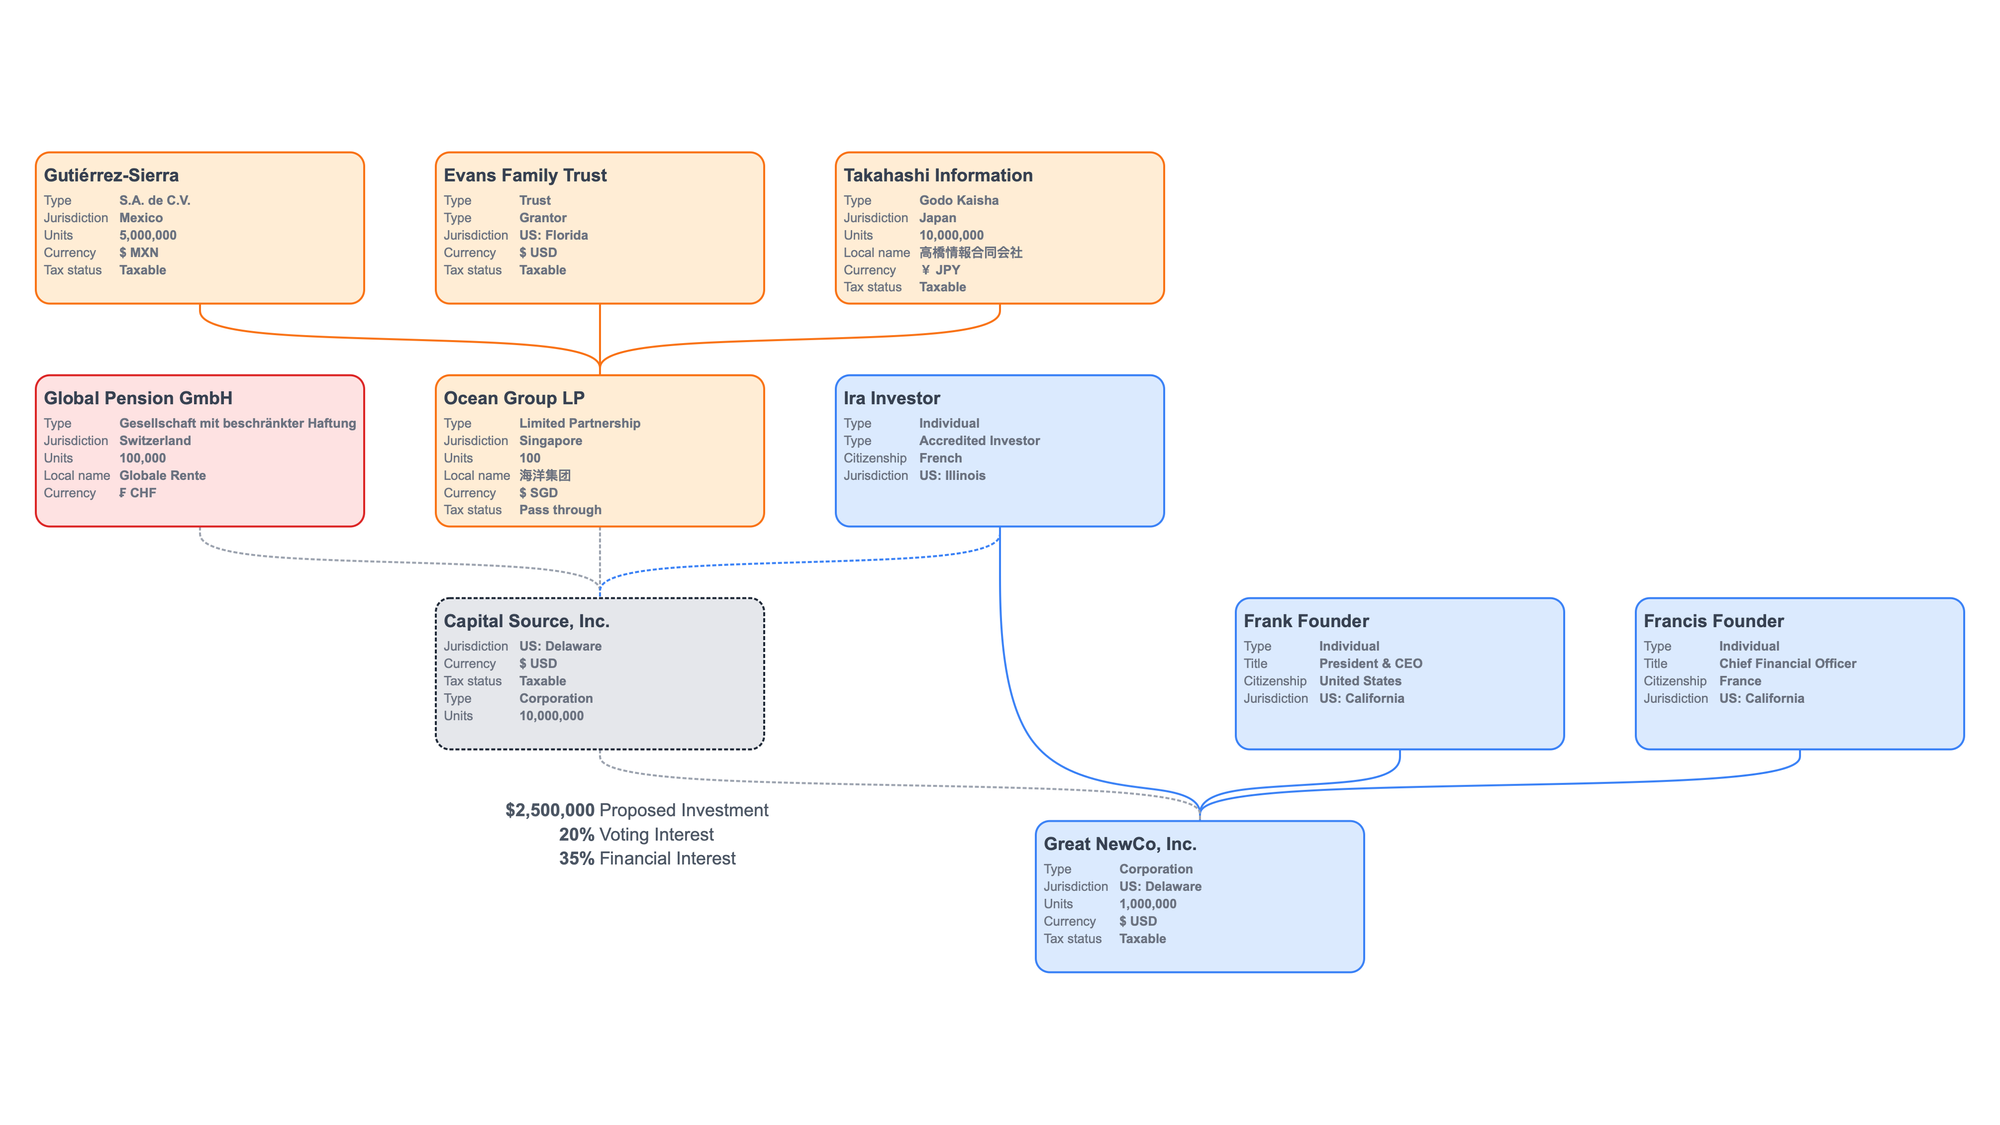
Legal entity types vary across national and subnational (state or province) jurisdictions. Entity types include: limited liability companies, corporations, limited partnerships, trusts, and many more.
A governance chart depicts the board of directors for a legal entity. Governance can include committees, standing or special purpose, within the board of directors. A governance chart should show the board, committees, and individual member assignments.
Management charts, or organization charts, show the supervisory relationships between managers and staff. There are many types of "org charts," but they all focus on the individuals performing work on behalf of a single legal entity.
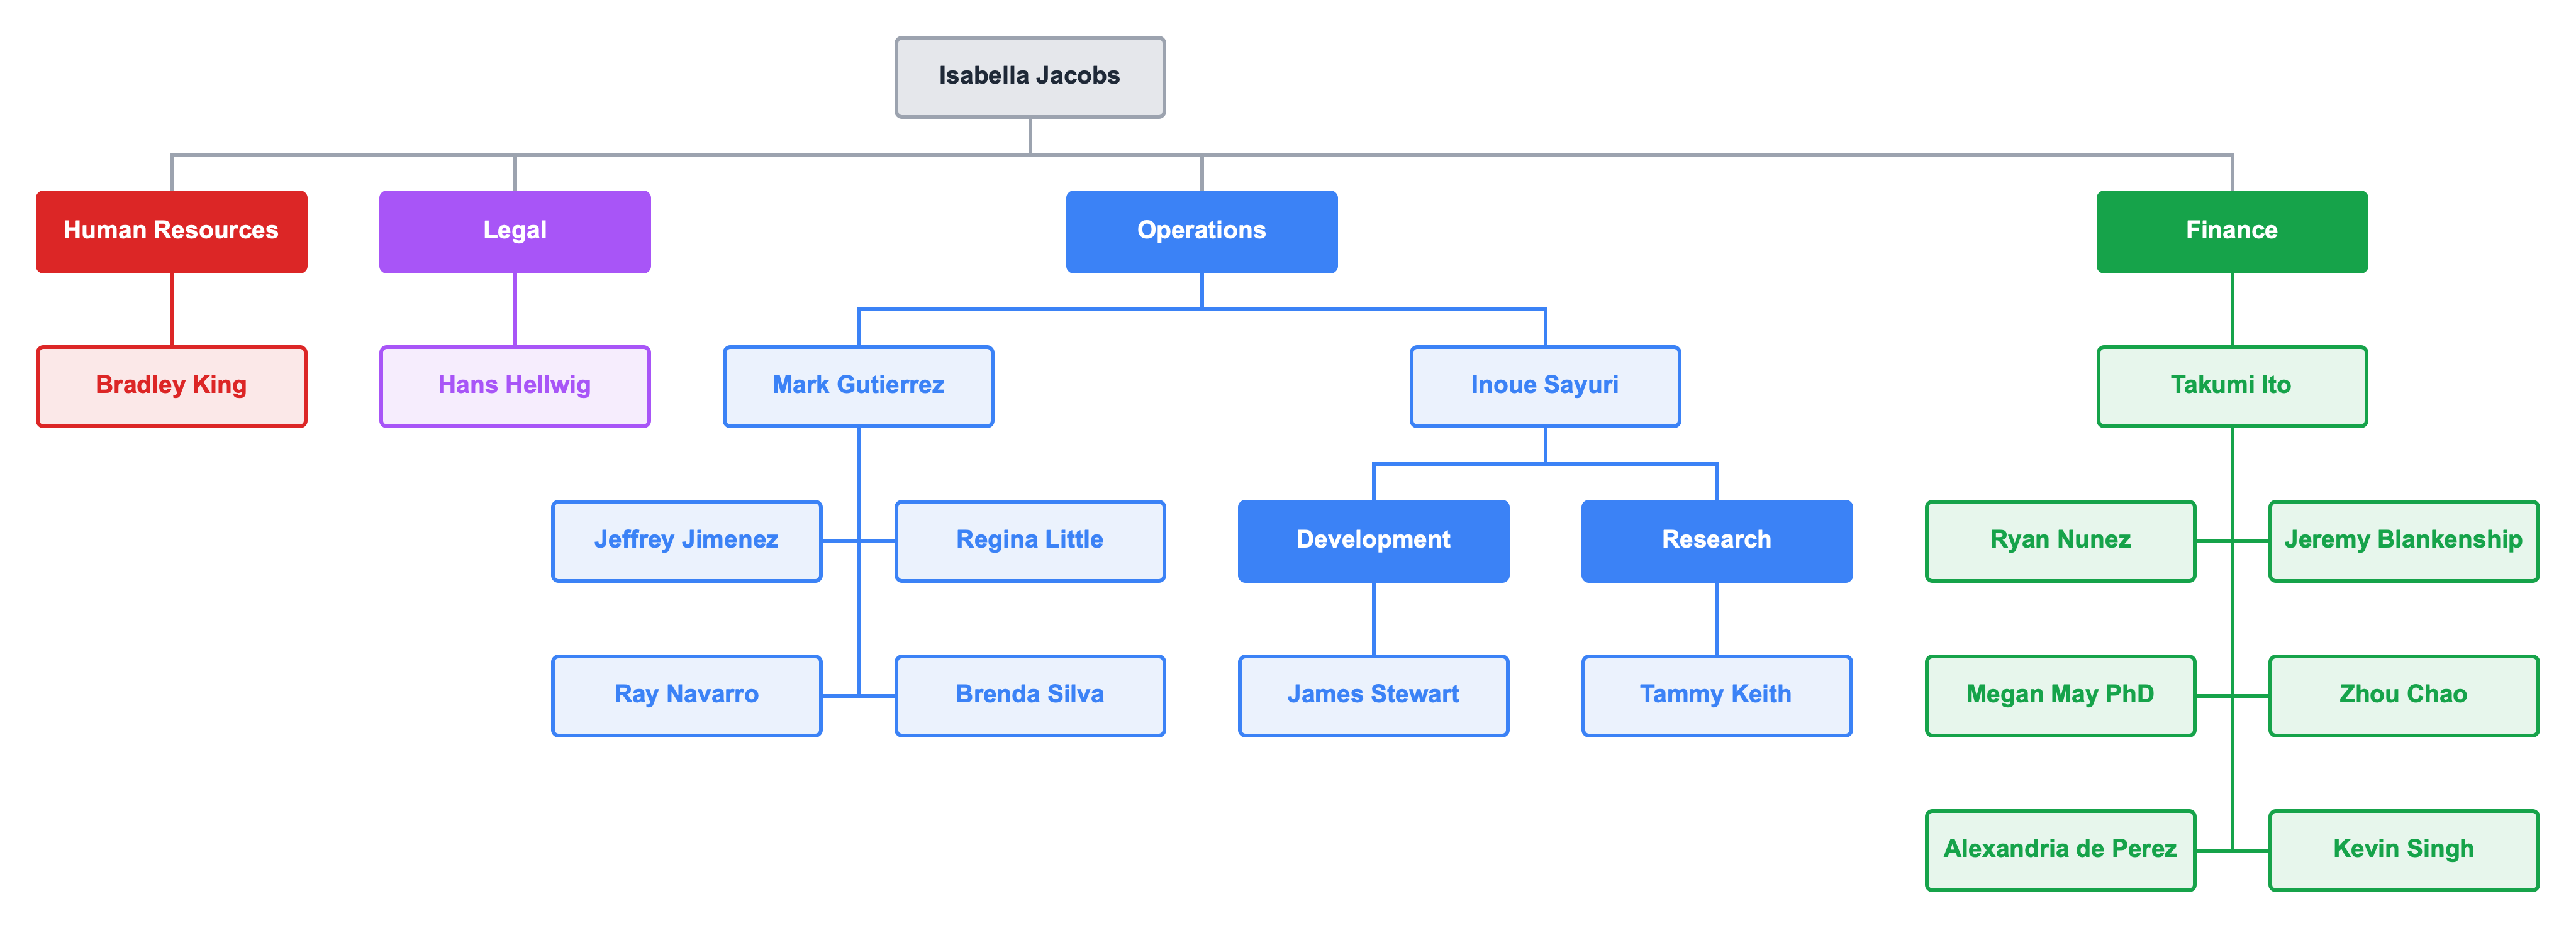
An organization chart is a visualization of the management relationships within a company, division, or department. An "org chart" is a subset of company structure charts that shows the reporting relationships among managers and staff.
How are company structure charts different from organization charts?
There are five conceptual differences between company structure and organization structure. Company structure charts are:
- Directed
- Unlimited
- Connected
- Grouped
- Looped
What does that mean?
Directed
Structure charts have a direction. They are top down. Owners, or parents, occupy the top of the chart. The chart continues through layers of ownership (or control) until the bottom layer where entities have no subsidiaries. Company structure charts are hierarchical.
Unlimited
An enterprise can have an unlimited number of legal entities. Any legal entity within the enterprise can have an unlimited number of owners (parents). Each of those owners can have their own owners ad infinitum. Each entity can have an unlimited number of subsidiaries (or "children").
Connected
Structure charts draw attention to the boxes (or cards) on the canvas. A card has the name and details about the company or individual which the card represents. In a structure diagram designed to show the hierarchical relationships between entities, the links or lines between the cards can be more important than the cards themselves.
The lines between legal entities carry a lot of weight. Here are a few examples:
- Financial interest as a percentage,
- Financial interest as a quantity (e.g. 10,000 shares or 100 membership units),
- Voting interest as a percentage,
- Voting interest as a quantity,
- Potential investment,
- Date link created (acquisition date),
Unlimited entities (companies or people) means that the chart can have an arbitrarily large number of boxes. To complicate matters, corporate structure diagrams contain unlimited connections (or links) between the entities. As a simplistic example, imagine a corporation which issues 1,000,000 shares and decides to sell a single share to one million people.
In a company structure chart, the line is the point.
While an employee might sometimes feel like there are a million bosses in "dotted line" management org charts, it is not the case in practice. Corporate hierarchy diagrams are unique since they have the potential for unlimited parents and unlimited subsidiaries.
Company structure charts show the owners of legal entities in an enterprise. Entities are placed on a vertical hierarchy, but the ownership lines do not have to respect those levels. These charts need to show "generation skipping" structure.
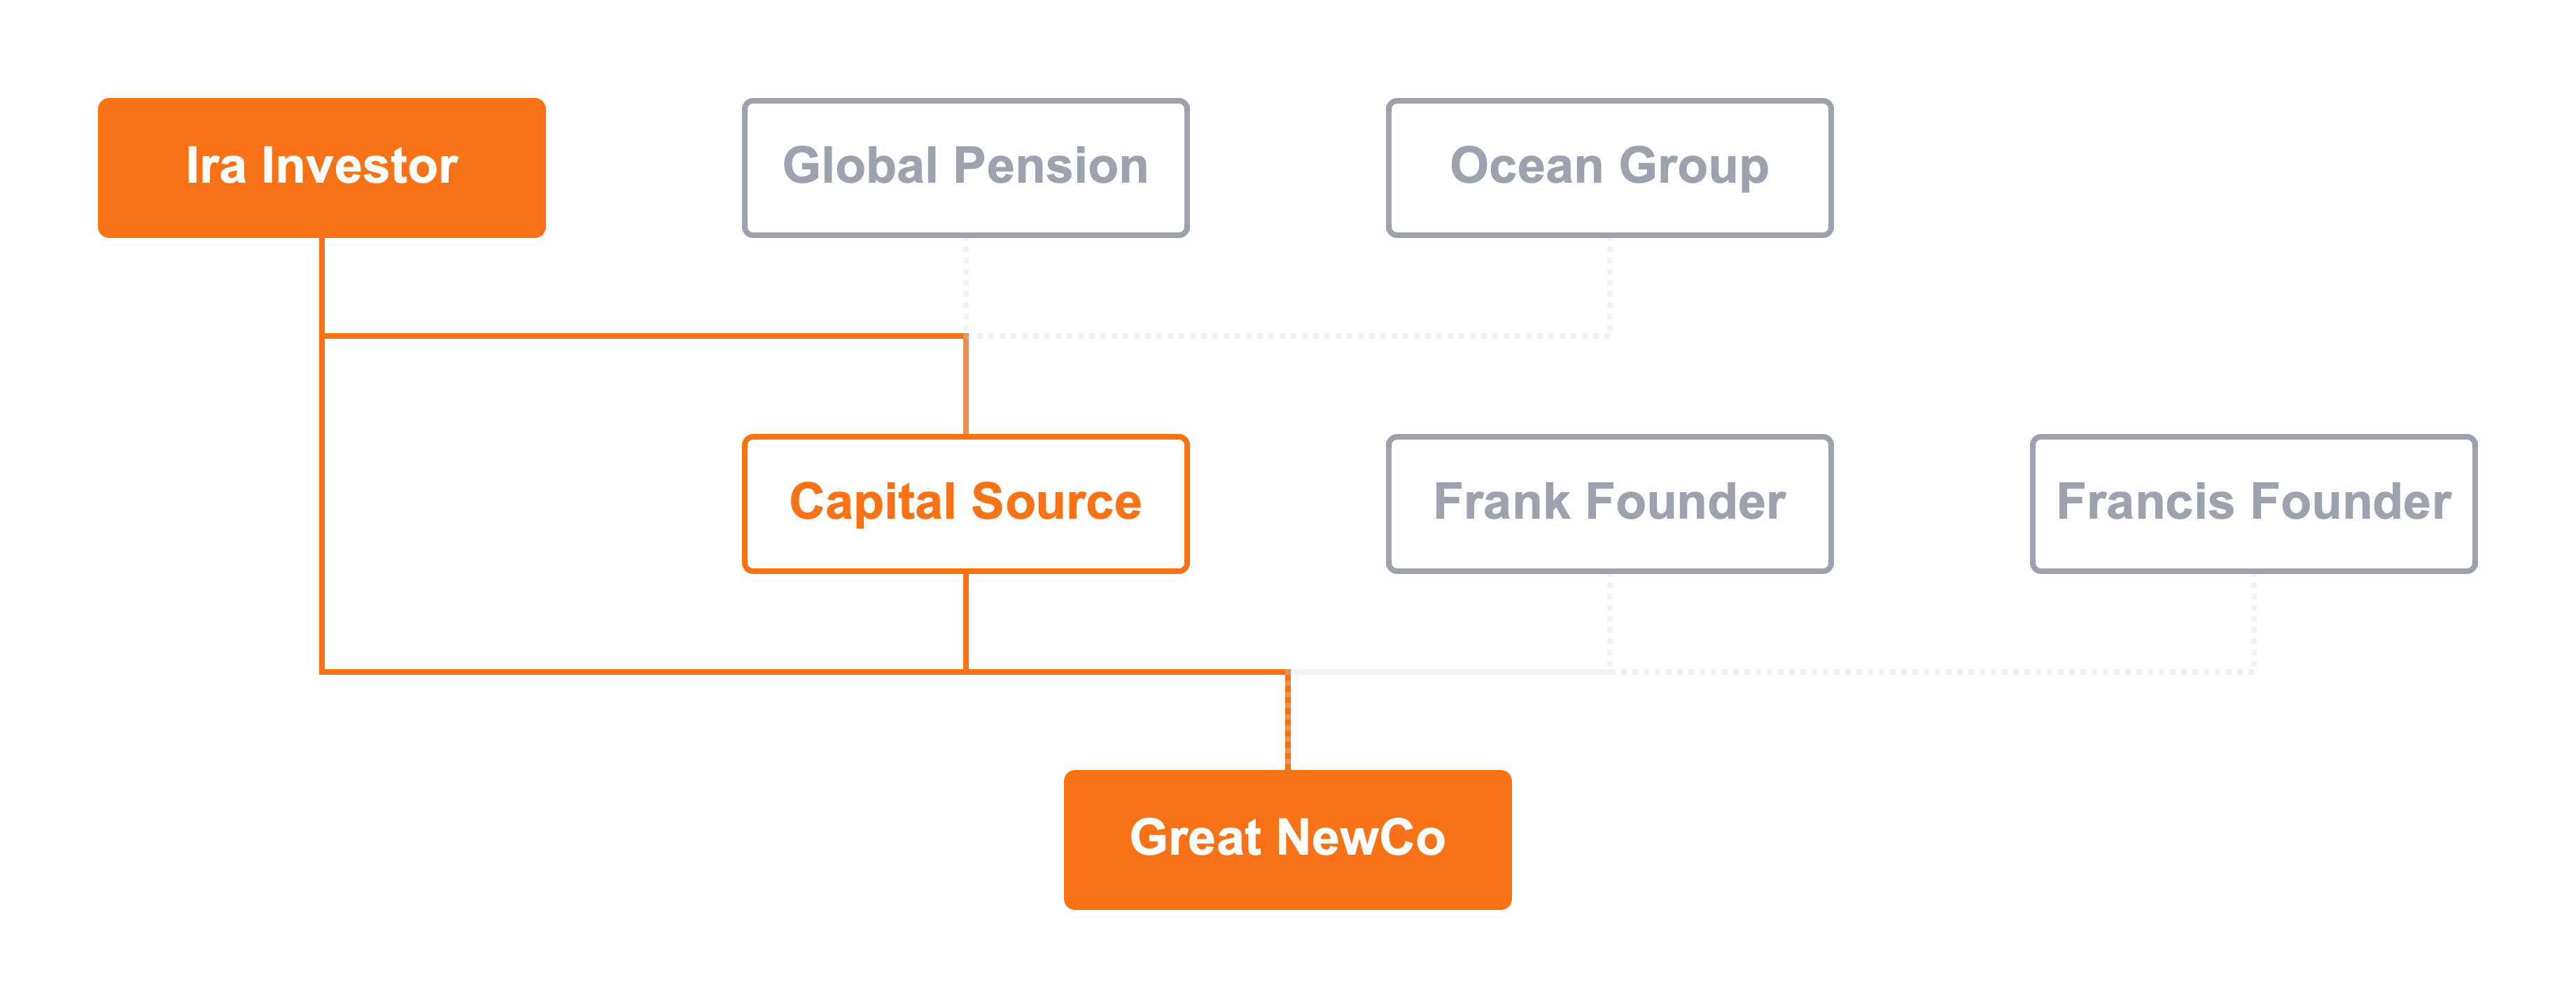
An ownership link skips a generation when a grandparent company owns a direct interest in an entity and owns an indirect interest through an intervening entity.
Grouped
Entities on a company chart are grouped on the vertical and horizontal axes. Vertical placement creates the initial hierarchy. Cards representing companies or individuals need to appear on strict generational levels based on their ownership (or other) link to other entities.
In the hierarchy of an enterprise, the chart needs to sort companies and individuals horizontally. That is easy to say. Since each company, however, can have its own micro structure with unlimited parents and subsidiaries ad infinitum, any horizontal sort needs to factor in the vertical structure. Horizontal sorting must minimize line crossing down through the chart.
To choose the best layout for a chart of legal entities which includes even a few complexities can challenge the most creative among us. Why is it so hard? The answer is mathematical. Given the constraints of company charts, there are, without exaggeration, millions of potential layouts. The vast majority are unattractive or confusing.
Looped, sometimes
There is a paradox for company structure charts. They are hierarchical, but once in a while a connection flows up the hierarchy. A card lower on the chart can have a connection that would normally place it above an entity higher in the hierarchy. How is that possible? Here are two examples.
While these loops are uncommon, they are not rare either. The potential for these loops in ownership or control make company structure charts distinct from organizational charts.
Company structure charts are directed, unlimited, connected, grouped, and looped. With those principles in mind, let's explore the purpose of a corporate hierarchy chart.
What is the purpose of a company structure chart?
Here are several reasons to create a corporate hierarchy diagram:
Communication
Lawyers, financial professionals, and tax advisors deal in words and numbers. Business owners, clients, and executives have not the time, training, or interest in digesting the details of company formation and structure documents. At the same time, they need to understand what you accomplished.
A picture would fill the void. Drawing that picture by hand is complicated and time consuming for professionals.
When clients want to understand the legal structure of their enterprise, a company structure chart is the solution.
Risk management
The corporate veil protects owners from liability stemming from the legal entity's business operations. This is the central tenet of corporate legal risk management.
Legal entity formation allows an enterprise to isolate aspects of its business. Certain activities might benefit from a particular jurisdiction's local law, but the rest of the enterprise would not benefit.
New ventures carry unique risk which a large company might want to isolate.
A company chart shows all the legal entities and what activities each pursues to illustrate the risk management benefit of the particular corporate structure.
Fundraising
When new or existing businesses raise money, they can form new legal vehicles to receive those funds. Investors might require that they invest in a specific jurisdiction which requires a new entity for that jurisdiction.
Fundraising can trigger restructuring a company, for example, from a limited liability company to a corporation.
Raising debt for financing can lead to restructuring to move collateral to secure the financing, or conversely to protect the collateral from creditors.
In each of these cases, a company structure chart can show a before and after view. The fundraising event manifests on the canvas of the chart.
Mergers and acquisitions
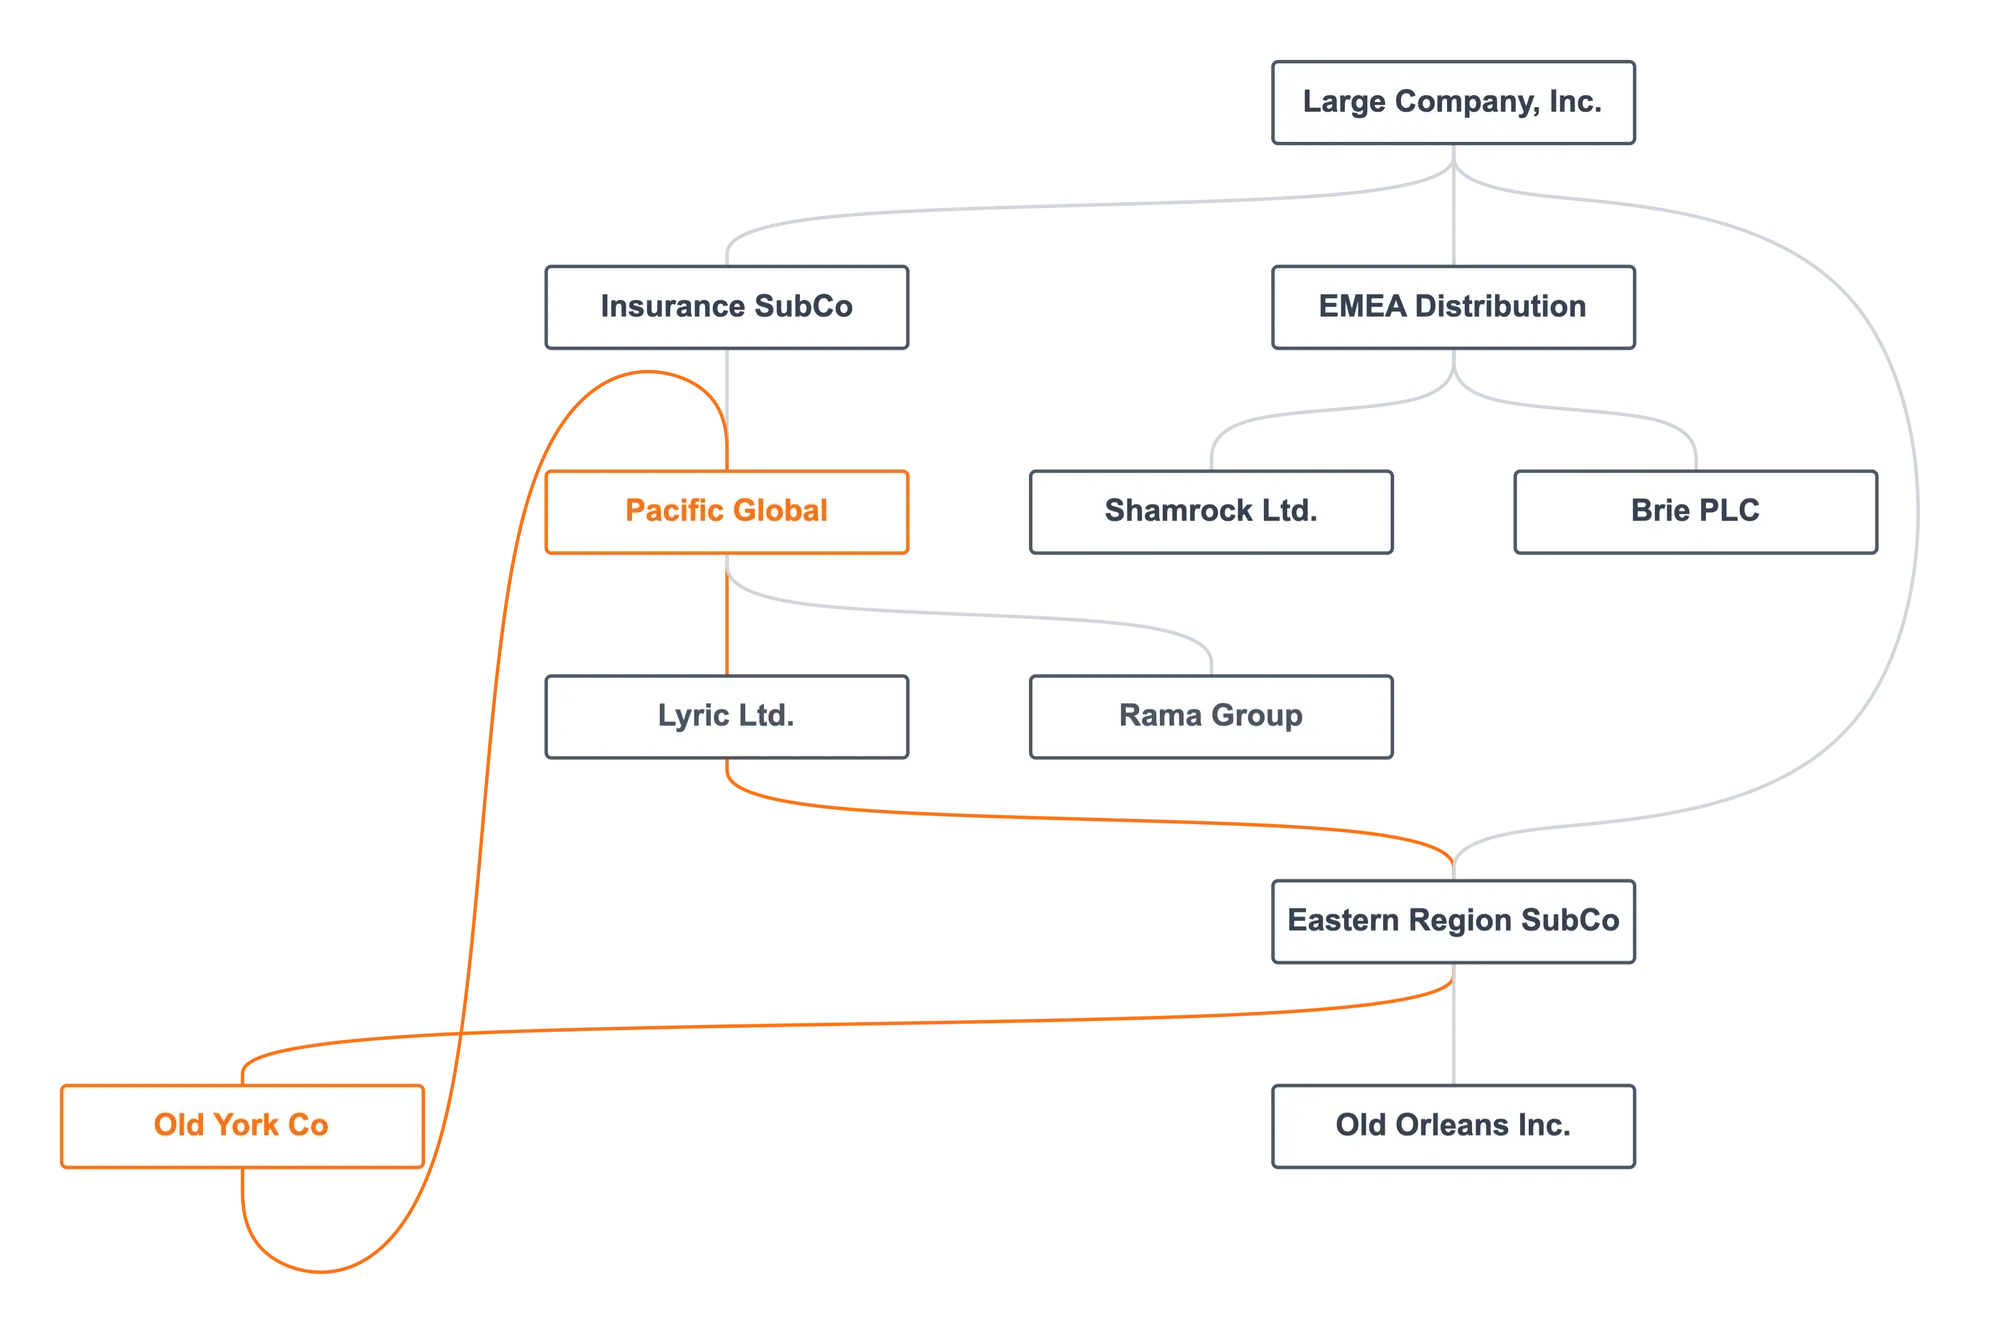
Lawyers, investment bankers, financial analysts, corporate development, and deal makers of all kinds produce structure charts for mergers and acquisitions (M&A) every day. Charts are useful for due diligence and post-acquisition integration. When used for maximum benefit, M&A charts help with deal modeling. The acquiring company can visualize scenarios for how the target will reshape the existing company structure.
As the due diligence team peals back the onion that is the target company, they create a more complete and nuanced view of the target company's structure. The chart of the target is best when it is a living, breathing representation that evolves with the flow of information. Entities are added, removed, and modified. Lines are drawn with more labels and data as the picture becomes clearer.
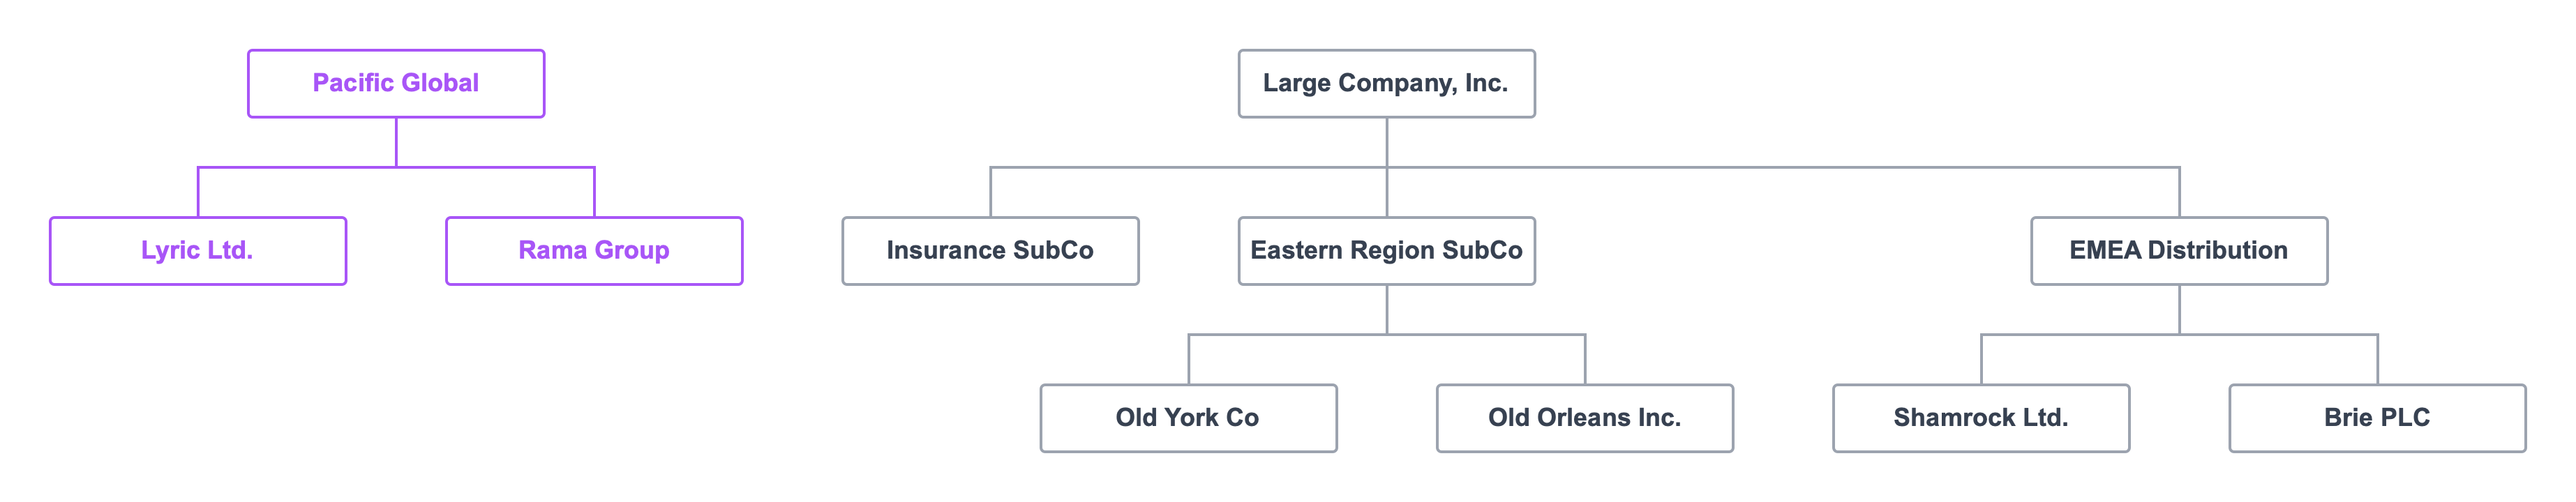
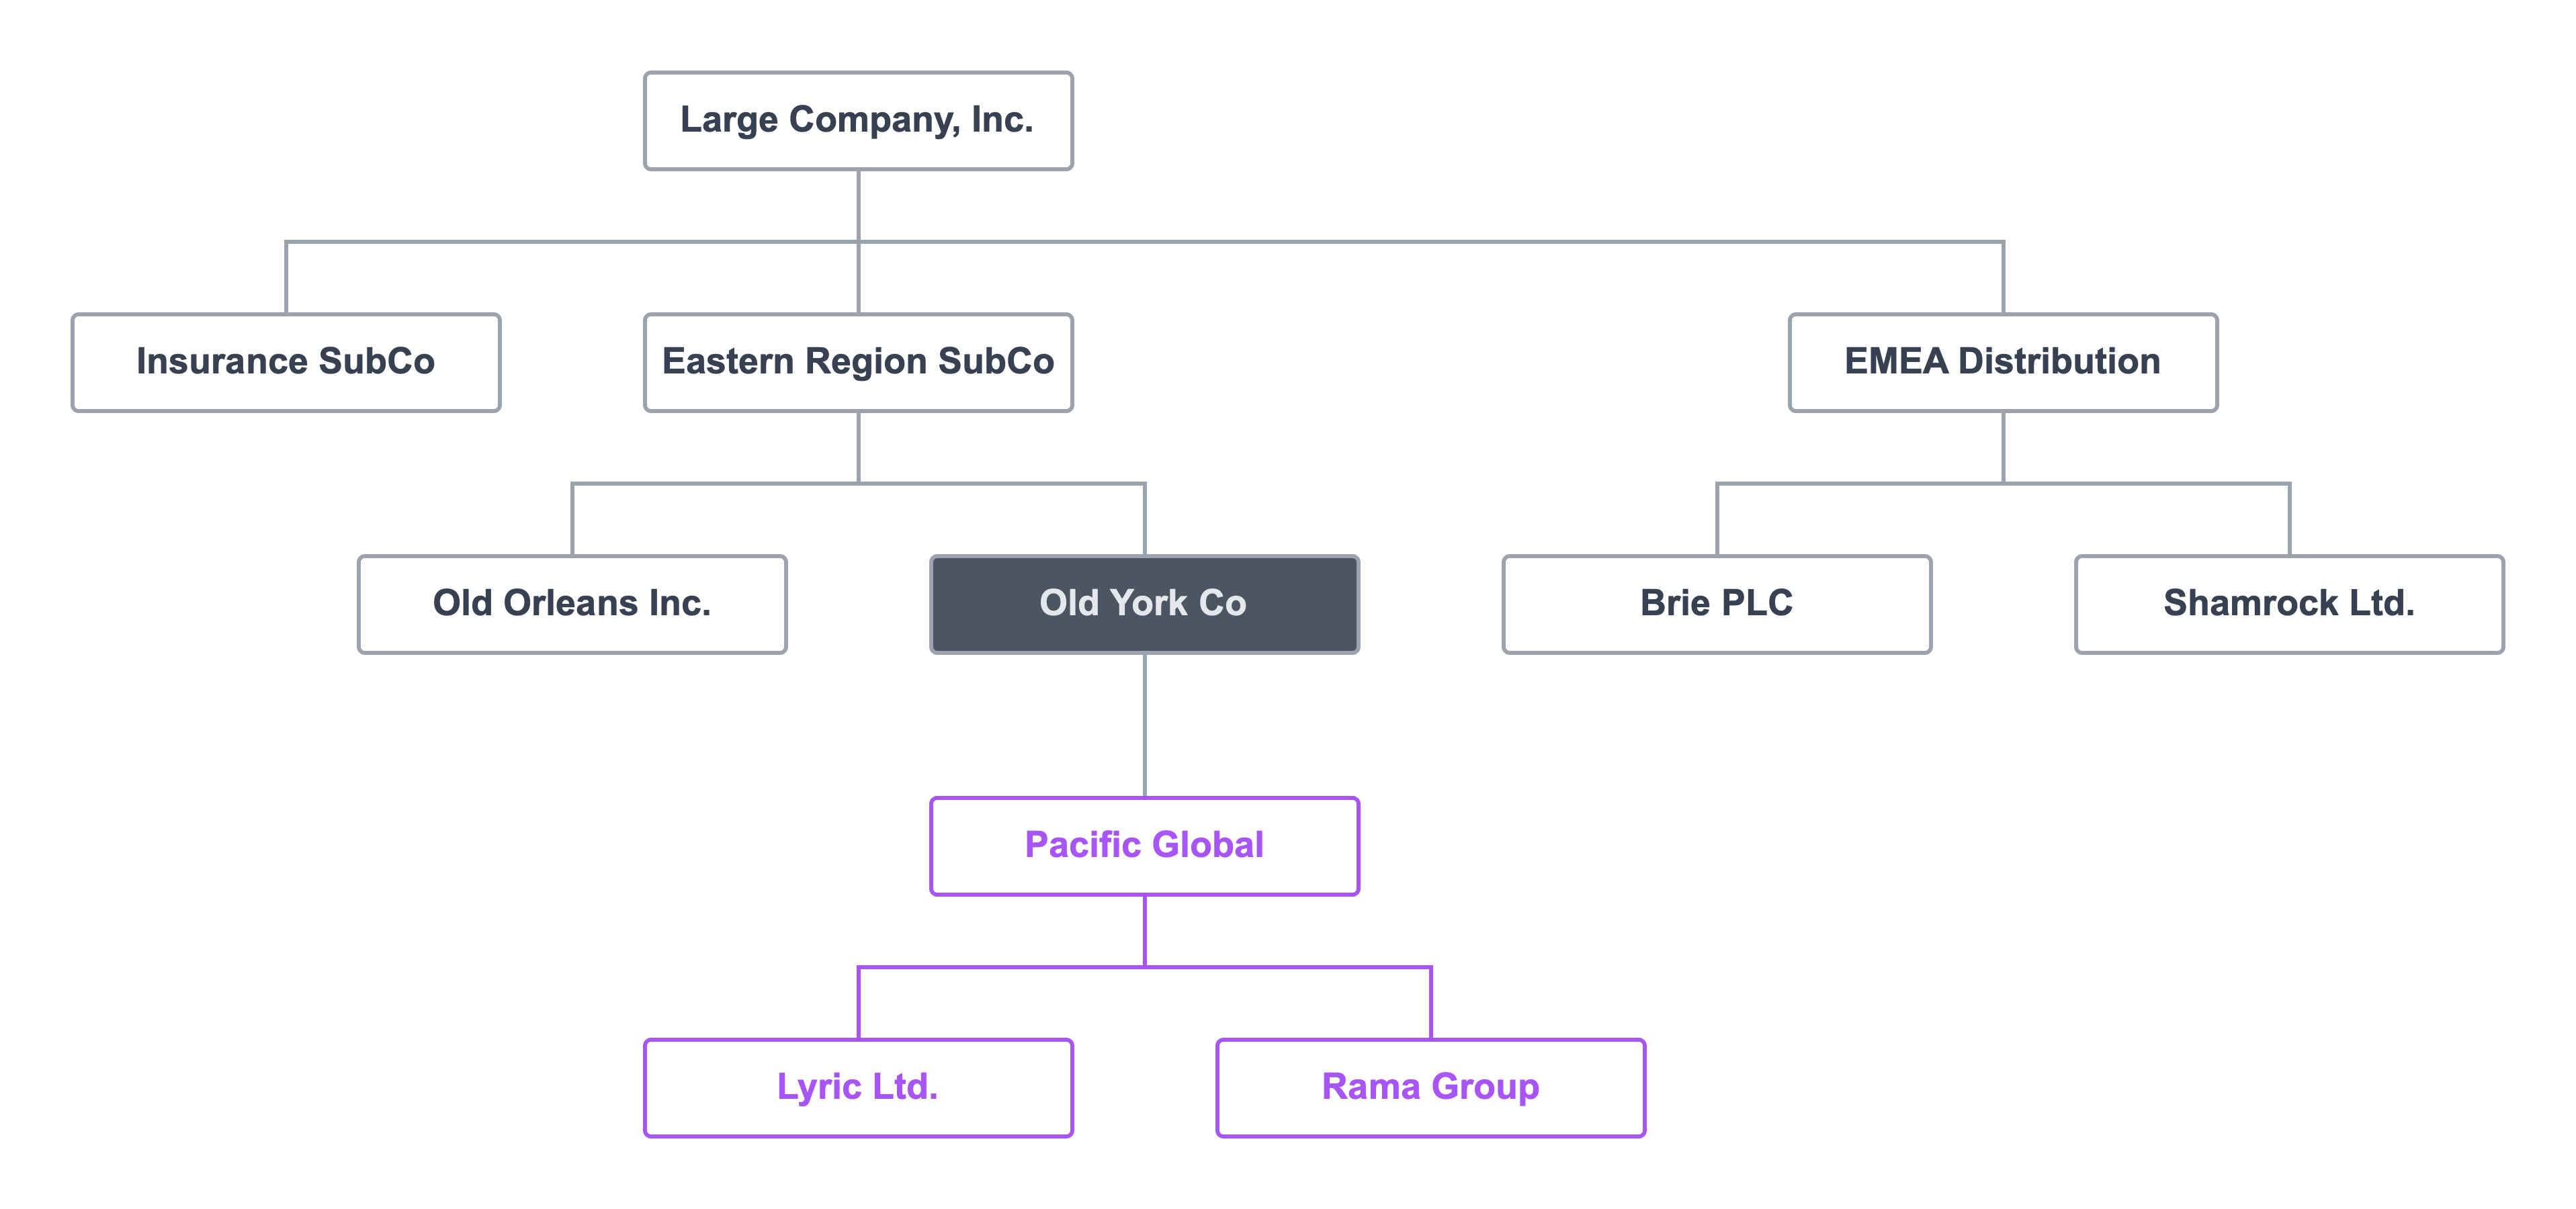
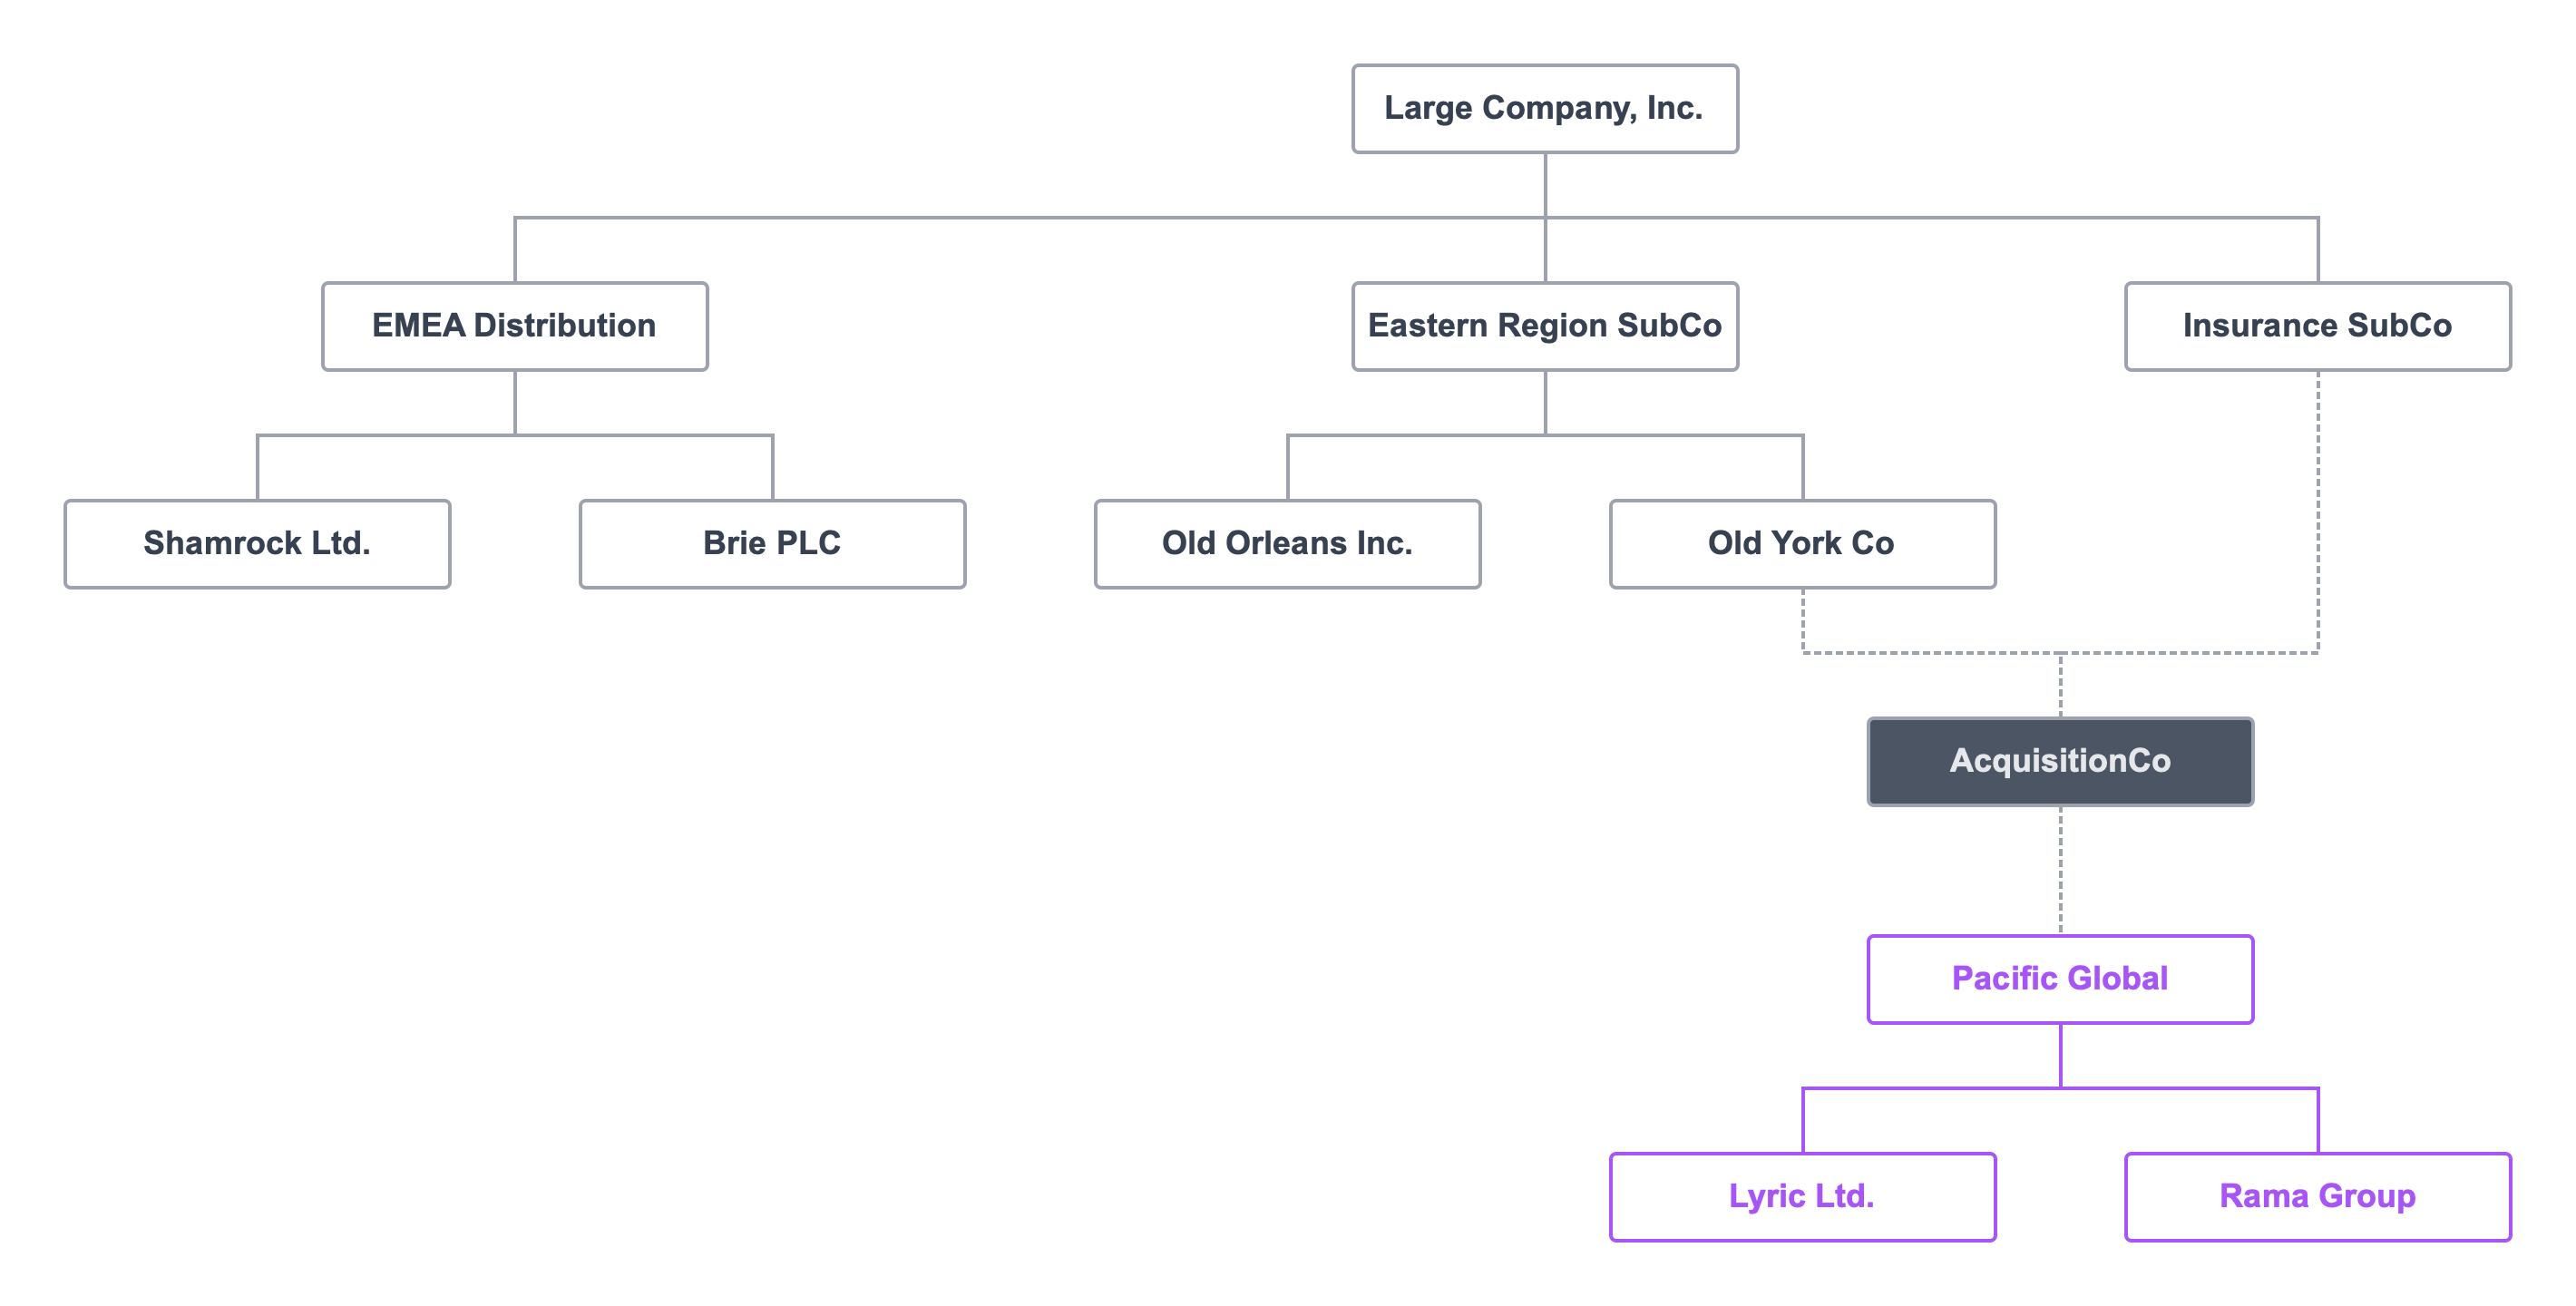
Here we have two separate entities. Large Company, Inc. plans to acquire Pacific Global.
The existing company Old York Co. could serve as the acquisition vehicle.
For a variety of reasons they decide that two existing entities, Old York Co. and Insurance SubCo should form a company for the acquisition called AcquisitionCo.
When the M&A transaction nears closing, the deal team works with the part of the business which will absorb the target. They develop a post-acquisition integration plan. Charts can show the answers to these types of questions:
- Which legal entity becomes the parent of the primary target?
- Do we form a new entity to complete the transaction? How does NewCo fit in the existing structure?
- Should we unwind parts of the target's legal structure for assignment to various existing entities?
- What changes for management reporting at the senior level?
- How do board seats change for the entities in question?
These are a few of the questions a structure chart can surface for the deal team and the business leaders who will operate the business.
Tax
Charts are important tax planning tools for any business. Company structure charts can assist with tax planning at the local, state or provincial, national, and international levels.
Sales and use tax
Sales and use tax planning can include new entity formation and inter-company agreements to isolate revenue generating events and operating company nexus. Company structure charts can visualize the effect of those changes on the company structure.
State or provincial taxes
In countries like the United States and Canada, companies form legal entities in particular jurisdictions and assign business operations to those entities in order to reduce tax liabilities. As local laws or business strategy changes, business charts can help model how to accomplish those changes in the company's structure.
Federal taxes
Choice of legal entity and tax code elections exert a profound influence on tax liability. In the United States, for example, an enterprise might consist of limited liability companies, corporations, and partnerships. Each of those entity types triggers a series of tax planning questions. LLCs are pass-through entities, unless the enterprise elects otherwise.
The type of partnership coupled with type of partnership interest (line on the chart) determines how partnership income is taxed.
An enterprise might form entities to take advantage of special provisions of the Internal Revenue Code such as:
- Foundations,
- Not-for-profits,
- Timber or agriculture holdings,
- Special economic zones, or
- Energy development investments.
A company chart can show alternative ways to structure the enterprise to improve tax liabilities.
International taxes
International tax planning is notoriously complicated. The US Internal Revenue Service discussed Global Tax Org Charts in its presentation on "International Overview Training: Post-2017 Tax Reform."
The IRS distinguished "global tax org charts" (GTOCs) from "legal entity charts" and "enterprise general ledger system charts." GTOCs show the US tax classification of entities and individuals, direct ownership of each entity, and the entity's place of incorporation.
The punchline? Legal entity types, jurisdictions, and ownership structure are critical to proper tax planning for every enterprise at every level of government. The company hierarchy chart illustrates the options.
Restructuring
Corporate restructuring can occur due to bankruptcy or external legal change. For example, a regulatory change could create incentives to reorganize the enterprise to benefit from the compliance changes.
The operational consequences of changing the legal structure of a business needs to meet the regulatory benefits. Variations in the company structure chart can focus the executive team's discussion of the pros and cons of restructuring.
Ultimate Beneficial Owner (UBO)
The ultimate beneficial owner is the natural person who controls an enterprise.
Beneficial owners are always natural persons who ultimately own or control a legal entity or arrangement, such as a company, a trust, a foundation, etc. – OECD 2019
Bankers, financial analysts, compliance officers, and law enforcement perform UBO analysis as part of financial crimes investigations. UBO analysis demonstrates the complexity of company structures, because criminal UBOs use legal obfuscation intentionally.
The structure chart allows investigators to explore complex legal structures to discover the UBO.
Know Your Customer (KYC)
Financial institutions around the world face compliance requirements to understand their clients. The "client" might be a single business, but the Know Your Customer (KYC) regulations in their jurisdiction require banks to look past the legal entity account holder. Banks will need to understand the corporate structure, including ownership connections, and officers and directors.
There is no substitute for a company structure chart which can depict the complex, international nature of modern global enterprises.
Those are a few reasons to create company structure diagrams.
How to create a company structure chart in 5 steps.
You need a corporate diagram, likely more than one, but how to start? I will outline five steps to create a chart from two building blocks.
Every company chart has two elements: a card and a link. The card is the rectangle on the canvas that represents an entity in the enterprise. Most cards represent a legal entity (company) or a natural person. They can, however, represent non-legal elements as needed, like a department, division, business unit, or other collection.
You can watch video tutorials on how to create a company structure chart if you prefer.
A link is the line that connects two cards. In a company chart, the link is always directed (hierarchical). One card owns, manages, or controls another card. The link shows that relationship.
With cards and links, you can build an empire.
The 5 steps to create a company structure chart are:
- Create immediate directed connections,
- Add labels and data to cards,
- Add labels and data to links,
- Design to communicate, and
- Share and collaborate.
Step 1. Start with immediate, hierarchical relationships
We see a lot of bad company charts. Most were ill conceived from the beginning. The problem is that chart designers have an end product in mind. They need to take a data-driven approach.
What does "data-driven" chart design mean? It means that you take one company (card) at a time. For each card, ask yourself two questions:
- Who are the immediate parents of this company, if any? Add those cards and draw those links. Do not worry about indirect relationships at the grandparent level and higher.
- Who are the immediate subsidiaries of this company, if any? Add those cards and draw those links. Do not worry about indirect relationships at the grandchild level and below.
Repeat that process for every company and person in the enterprise with these constraints:
- Never repeat a card. A company or person must exist only once on the chart. Cards with similar names should be delineated to avoid confusion.
- Never draw more than one line between the same two cards. If you want to show a multifaceted link, accomplish that in Step 3, but draw only one line. Multiple lines clutter the chart and reduce clarity. Avoid the temptation.
Once you have completed the directed pairs of cards and links, you should have a clean structure.
Step 2. Add labels and data to cards
With Step 1, you accomplish more than you might appreciate at first. Rendering the entire structure, the network of connections between entities, is an impressive feat given the complications we have discussed.
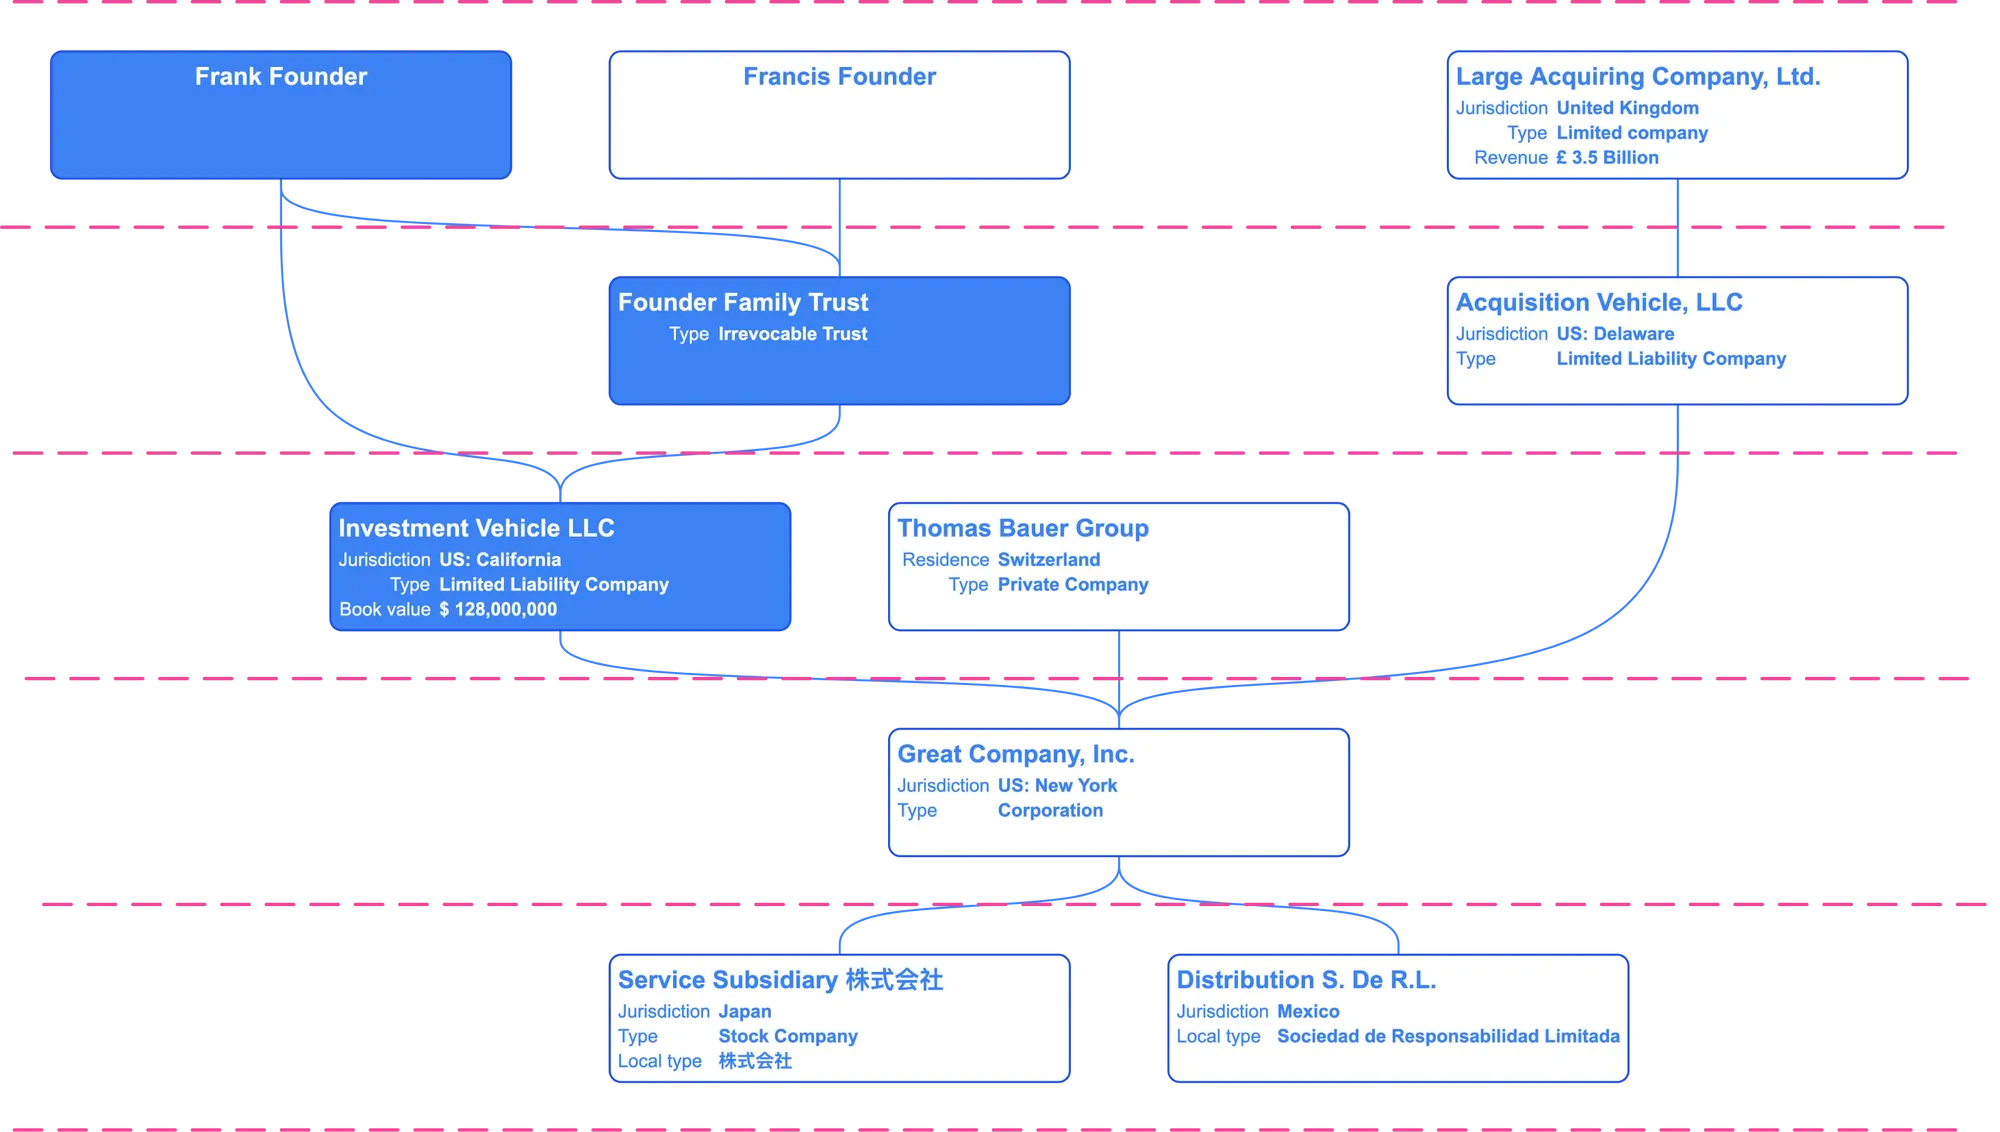
In Step 2, you add information to cards. The information needed varies based on the type of chart and the role of the card. I will give examples of commonly used labels and data in cards by type of chart. "Labels and data" means the semi-structured information about the company or person. A label is consistent across the cards in the chart; a piece of data is unique to the card.
Cards in ownership charts
Recall, an ownership chart shows the parents and subsidiaries of an enterprise. Here are examples of labels you might use for each card:
- Name,
- Jurisdiction,
- Legal entity type,
- Tax status,
- Ownership units, and
- Local name.
This is neither a mandatory nor exhaustive list.
A table of cards with labels and data might look like this:
| Name | Jurisdiction | Entity Type | Tax Status | Units | Local Name |
|---|---|---|---|---|---|
| Great NewCo | California | LLC | Pass through | 100 | N/A |
| Big Company | Delaware | Corp | Taxable | 1,000,000 | N/A |
| Takahashi Information | Japan | Godo Kaisha | Taxable | 1,000 | 高橋情報合同会社 |
You do not have to create spreadsheets of data. In fact, there is cognitive dissonance when you try to design ownership charts in a spreadsheet. The table only highlights the kind of data you might add.
Cards in a governance chart
A governance chart presents the board of directors, committees, and other compliance functions for a single legal entity. Cards in a governance chart include: board members, committees, and the board itself.
For each card, you might include:
- Name,
- Title ("chair" or "director"),
- Authority (what can the person or group do), and
- Responsibility (what must it do).
The labels and data for an Audit Committee might look like this:
| Name | Authority | Responsibility |
|---|---|---|
| Audit Committee | Hire outside auditor | Certify audit to full board |
Again, this is better done directly on the chart.
Cards in a management chart
The cards on a management chart, or human resources org chart, generally represent people. Labels and data can include: Name, Title, Role, and Start Date.
Step 3. Add labels and data to links
At the conclusion of Step 2, your chart not only shows the connections between cards, it describes the cards in a clear and consistent manner.
In Step 4, you add information to links. The information needed varies based on the type of chart and the role of the links. I will give examples of labels and data for connections by type of chart. Again, the labels should be consistent across links. The labels will differ from those used for cards, because link labels describe the connections, not the cards.
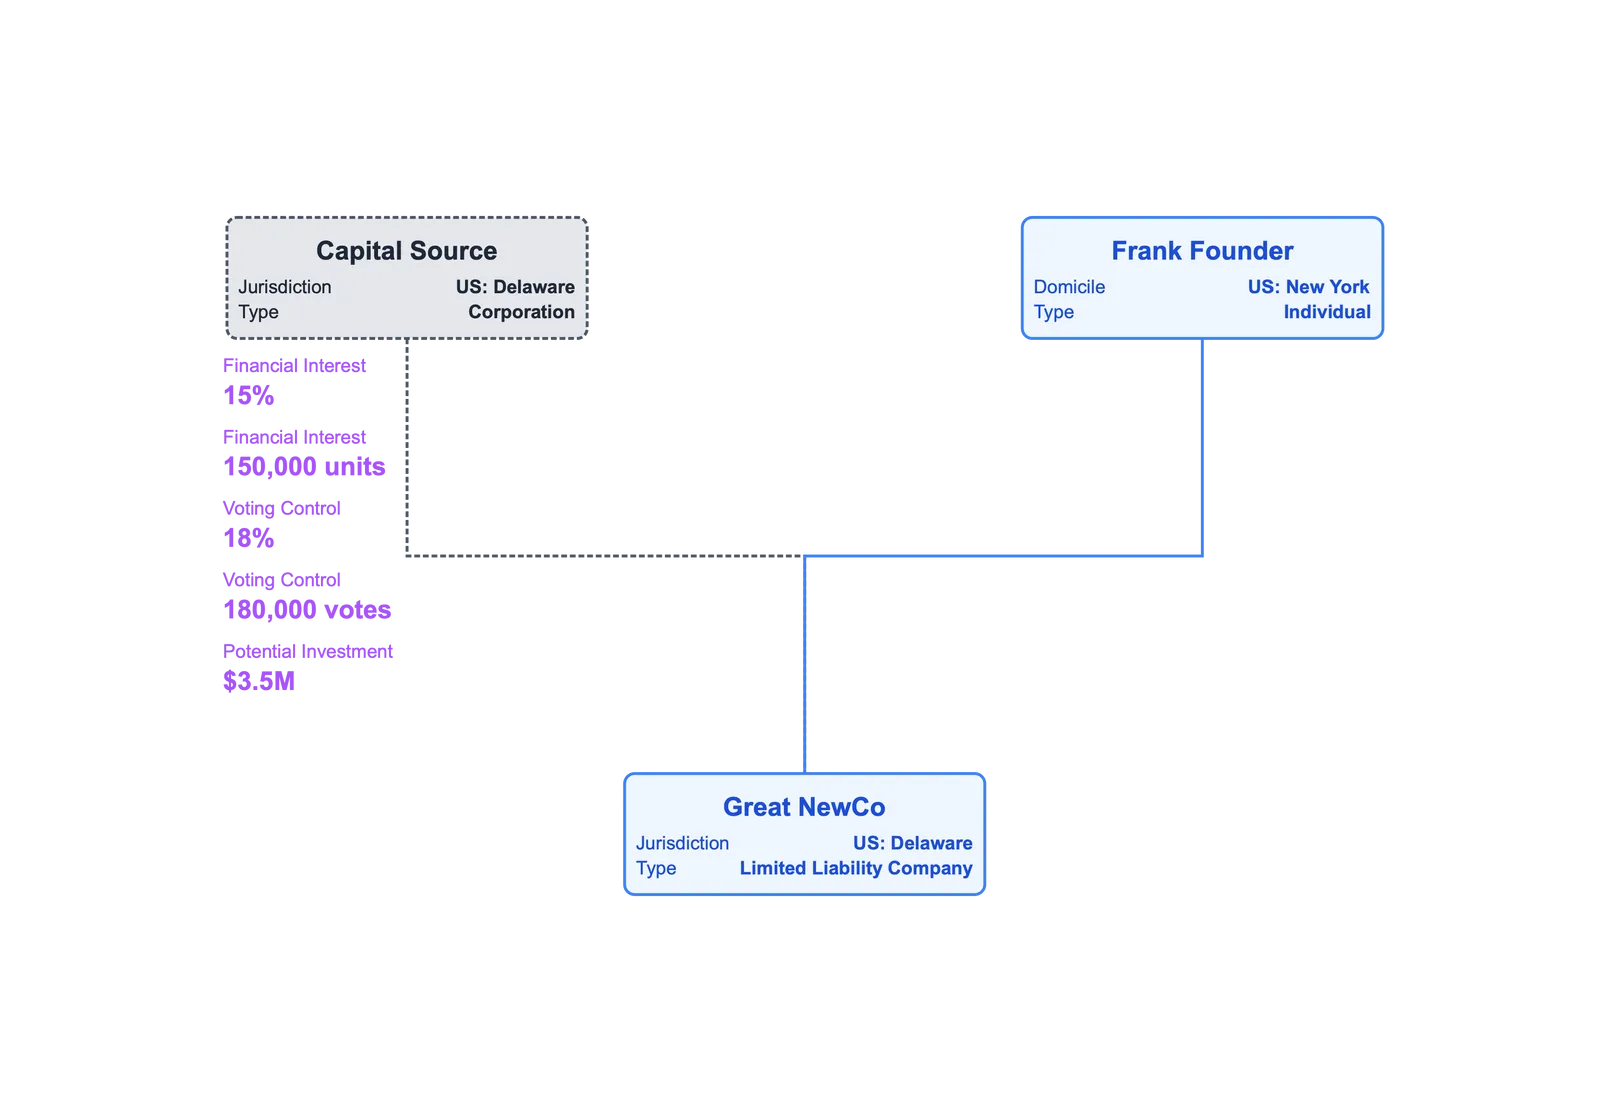
Links in ownership charts
The labels and data for links in an ownership chart vary based on the purpose of the chart. These examples illustrate what is possible:
- Financial interests in units
- Class A Shares
- Membership units
- Partnership units
- Financial interests as percentage
- Beneficial ownership
- Economic share
- Financial share
- Voting interests in units
- Class B Shares
- Membership votes
- Partnership votes
- Voting interests as percentage
- Total control percentage
- Management control
- Partnership control
- Debt
- Amount
- Convertible
- Term
- Contract
- Type
- Expires
- Value
- Purpose
It is helpful to have labels consistent across links.
Links in governance charts
The links in a governance chart usually represent assignments. Labels describe those assignments such as: date or scope.
Links in management charts
With management charts links labels and data are often not necessary. You can, however, add labels and data which describe those connections as necessary.
Step 4. Design to communicate
To this point, your company chart is gray boxes and lines. You can stop. The map of the enterprise shows the important information. Mission accomplished. A five step process is only three steps.
Choices about design -- color, fonts, backgrounds -- are best made judiciously. A light touch suffices. Useful company chart design principles:
- Prioritize readability. Black text on darkened backgrounds is difficult to read. If you make the card background a solid color, try a light color for the text. Yellow is an exception.
- Prioritize consistency. Variation communicates meaning. Using different colors for their own sake is confusing, not illuminating.
- Shapes are overrated. Cards should be rectangles. Shapes do not have a clear meaning without a legend. A legend diminishes the communicative value of the shape. Use card labels and data instead. The meaning is more clear with text.
- Use design choices to focus the viewer. Try keeping the chart grayscale, except for the bits that are under consideration.
- Color is best for grouping. If you must color cards on a chart, use it to highlight groups of cards in meaningful ways.
There are many unfortunately cluttered company charts. Dare to be clear.
Step 5. Share
It would be a shame to keep your luminous corporate hierarchy chart to yourself. It will ideally communicate what matters all on its own (however, embedding the chart in a presentation is probably inevitable). The fixed canvas dimensions of presentation software work against readability for charts of any size.
A better solution is to present the chart in an application without fixed dimensions. Better still, if that software allows you to collaborate on the chart with colleagues.
Conclusion
Company structure charts can challenge seasoned legal and financial professionals. This Ultimate Guide to Company Structure Charts spells out the reasons the occasional company org chart takes longer than you want. Hopefully, these steps can simplify the process for you.
I love to see examples of challenging charts. Free free to contact us with suggestions or ideas.