

Key Concepts
Lexchart creates your organization chart layout automatically. Unlock the power of Lexchart with these key concepts. Used in combination, these simple building blocks create a remarkable visualization of company structure.
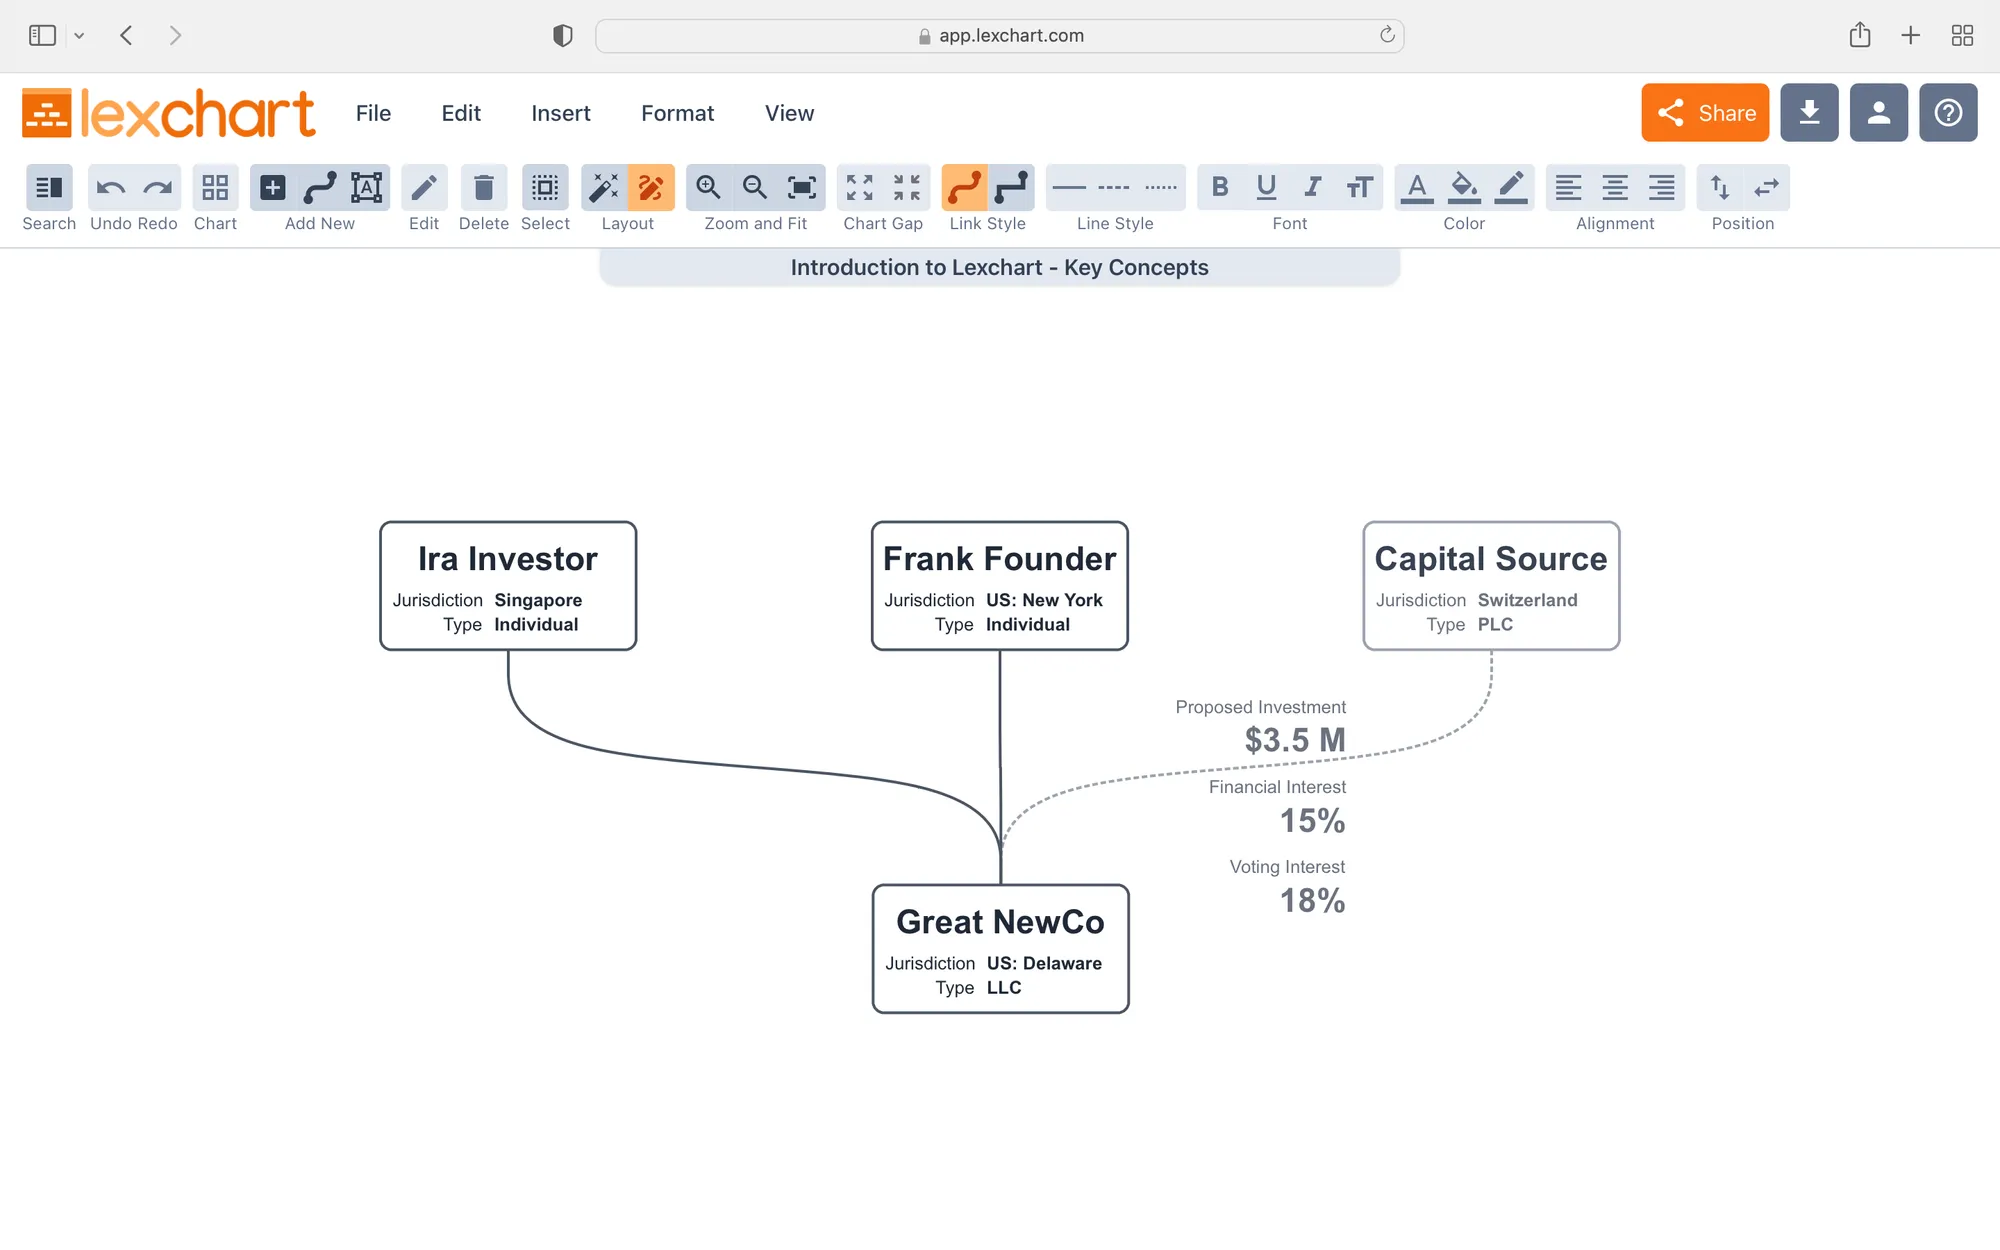
Focus on the link between two entities (companies or people).
A connection between two items should be immediate and ordered. These two examples illustrate the approach
- Ownership charts: focus on a company. Who are the immediate owners, and what are the immediate subsidiaries?
- Management charts: focus on a person. Who is that person's immediate manager, and who are the person's direct reports?
Card
A Card in Lexchart is a company or person (or other element) on the chart. Each card has a name for the company or person.
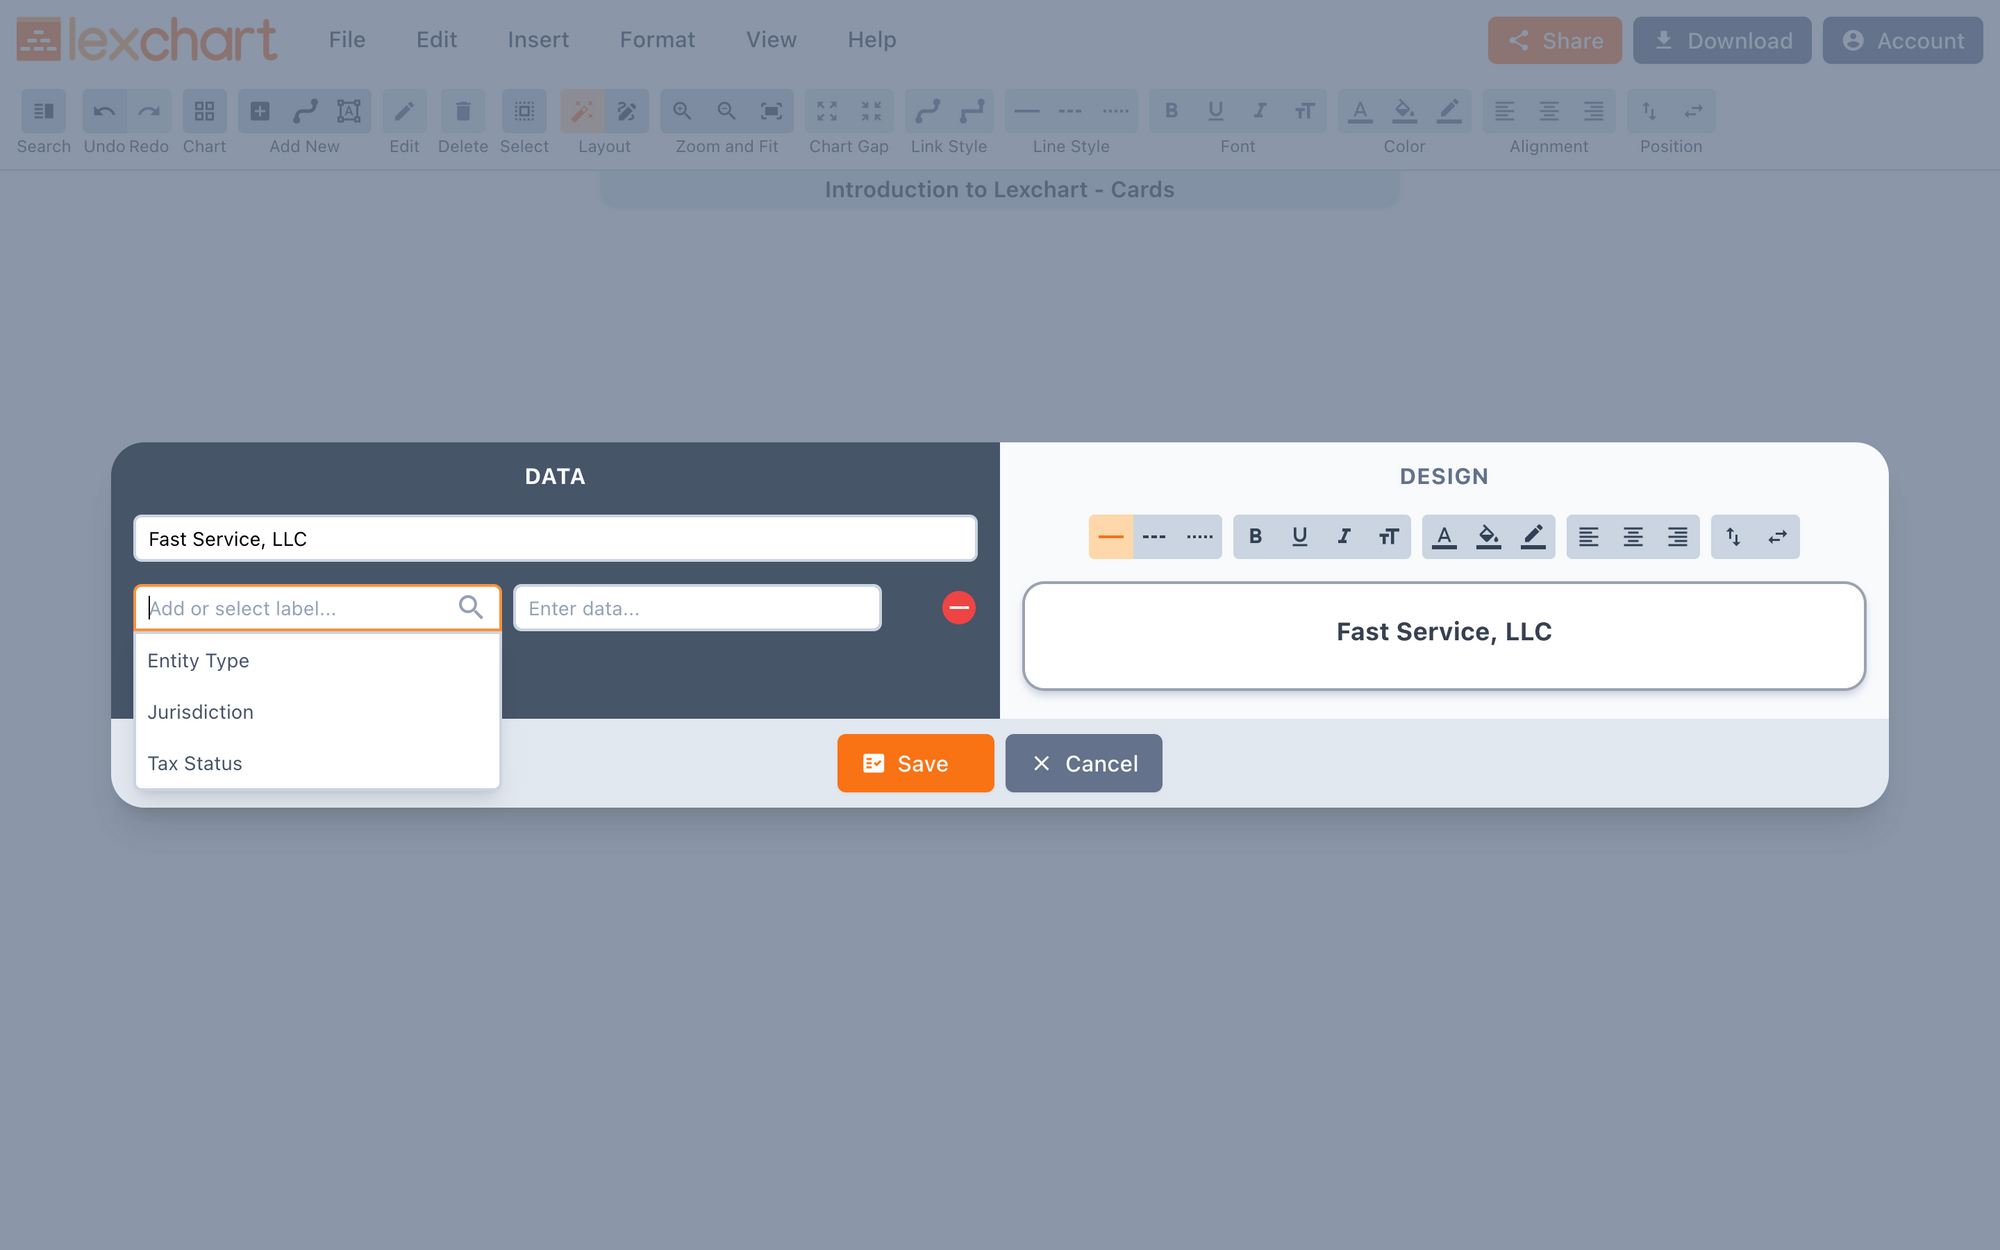
You add and edit cards through the Card window. This is a window to control the name, data, and design of the card.
Data
Each card can contain information about itself. Each piece of information can have a label and data.
A Delaware corporation called Great NewCo, Inc. would have this information:
| Label | Data |
|---|---|
| Jurisdiction | United States: Delaware |
| Entity Type | Corporation |
| Tax Status | Subchapter C |
Lexchart allows you to create unlimited labels and data. You can reuse labels across cards on the chart. Here are two cards, which share labels but have different data.
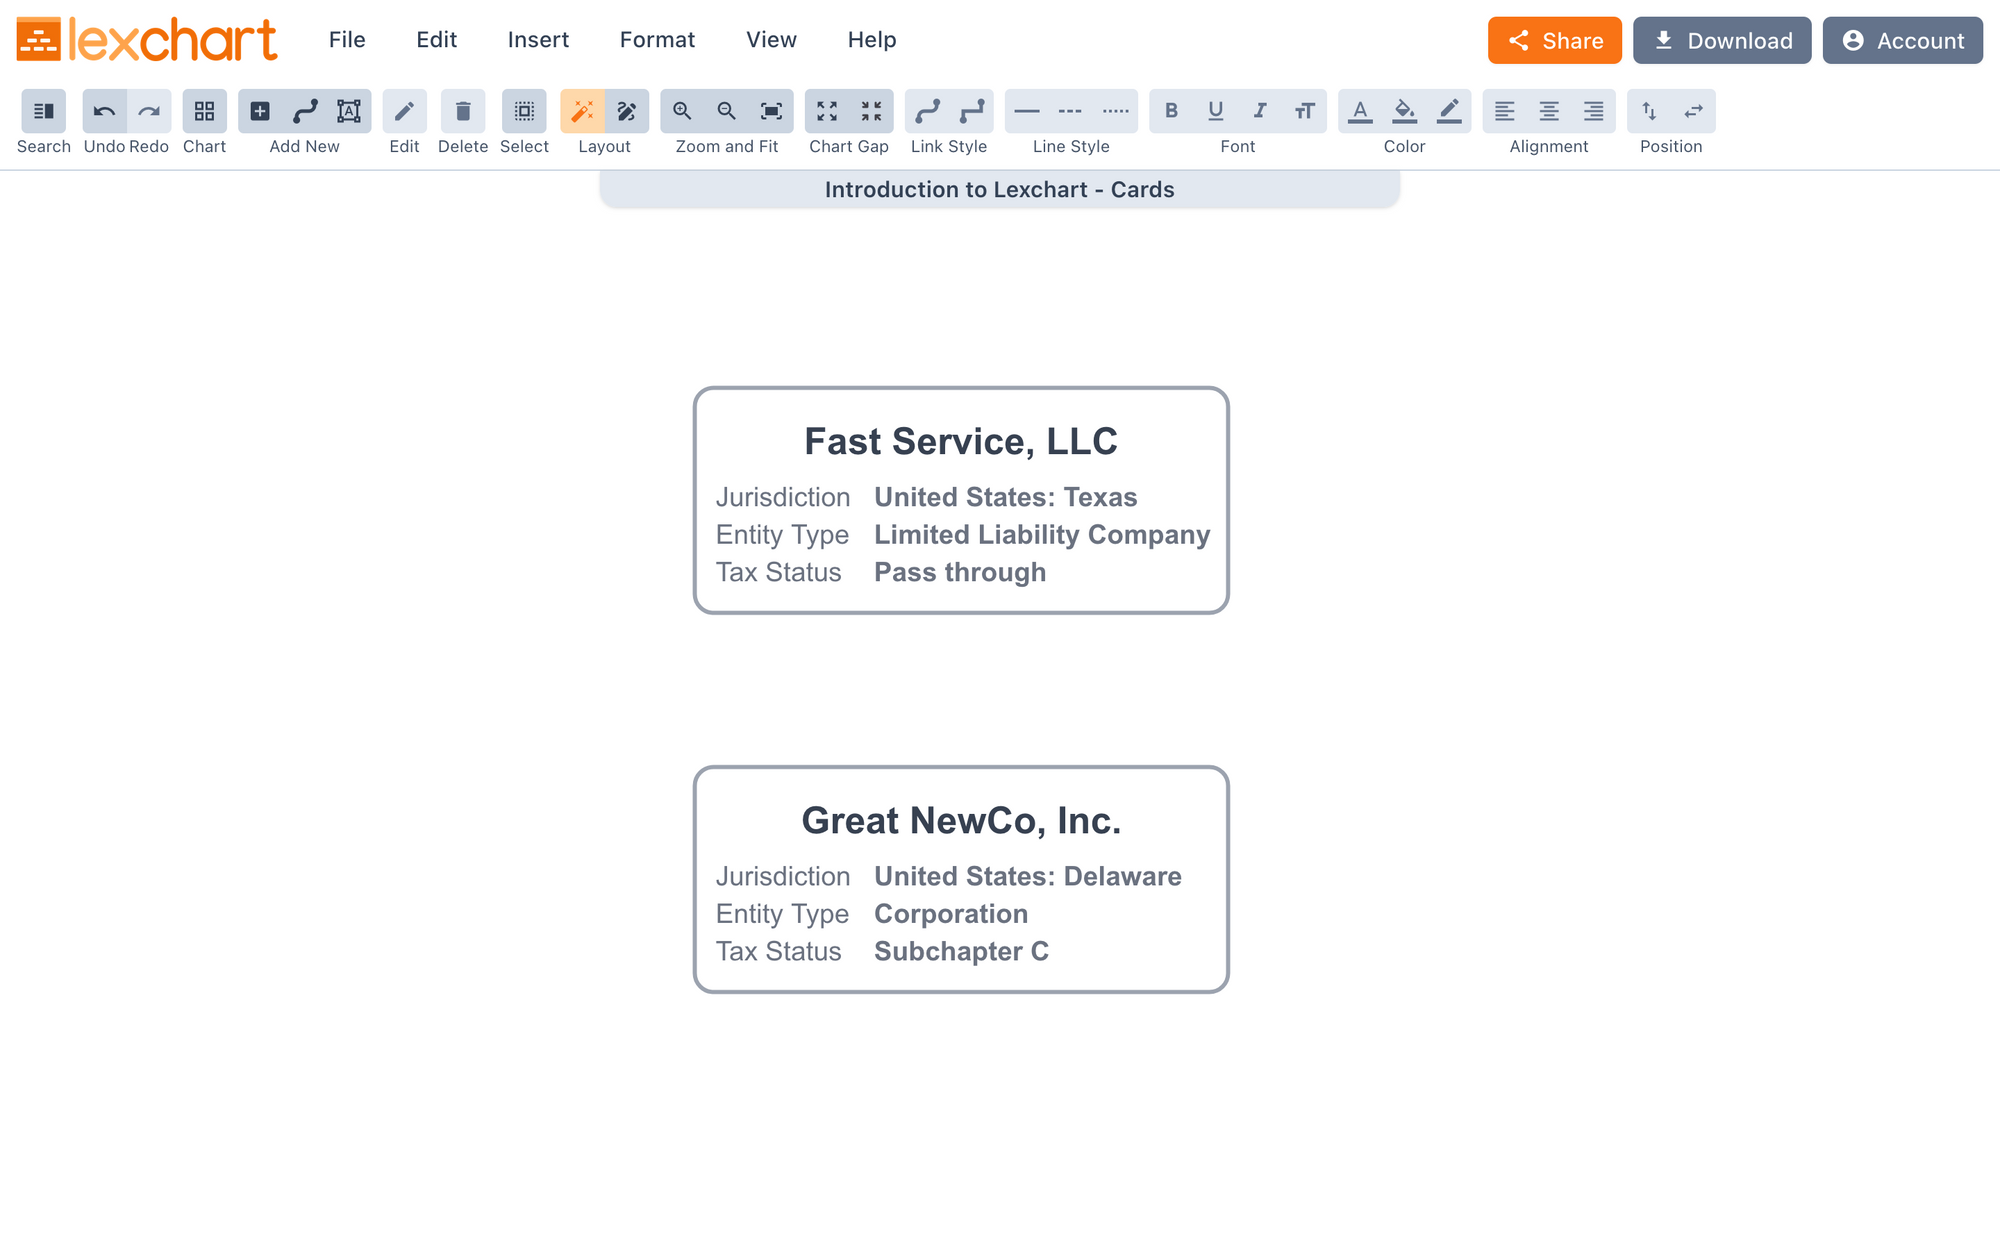
When we create Great NewCo, Inc. we create the labels once. When we create Fast Service, LLC next, those labels are automatically available
You can create a unique label for one card.
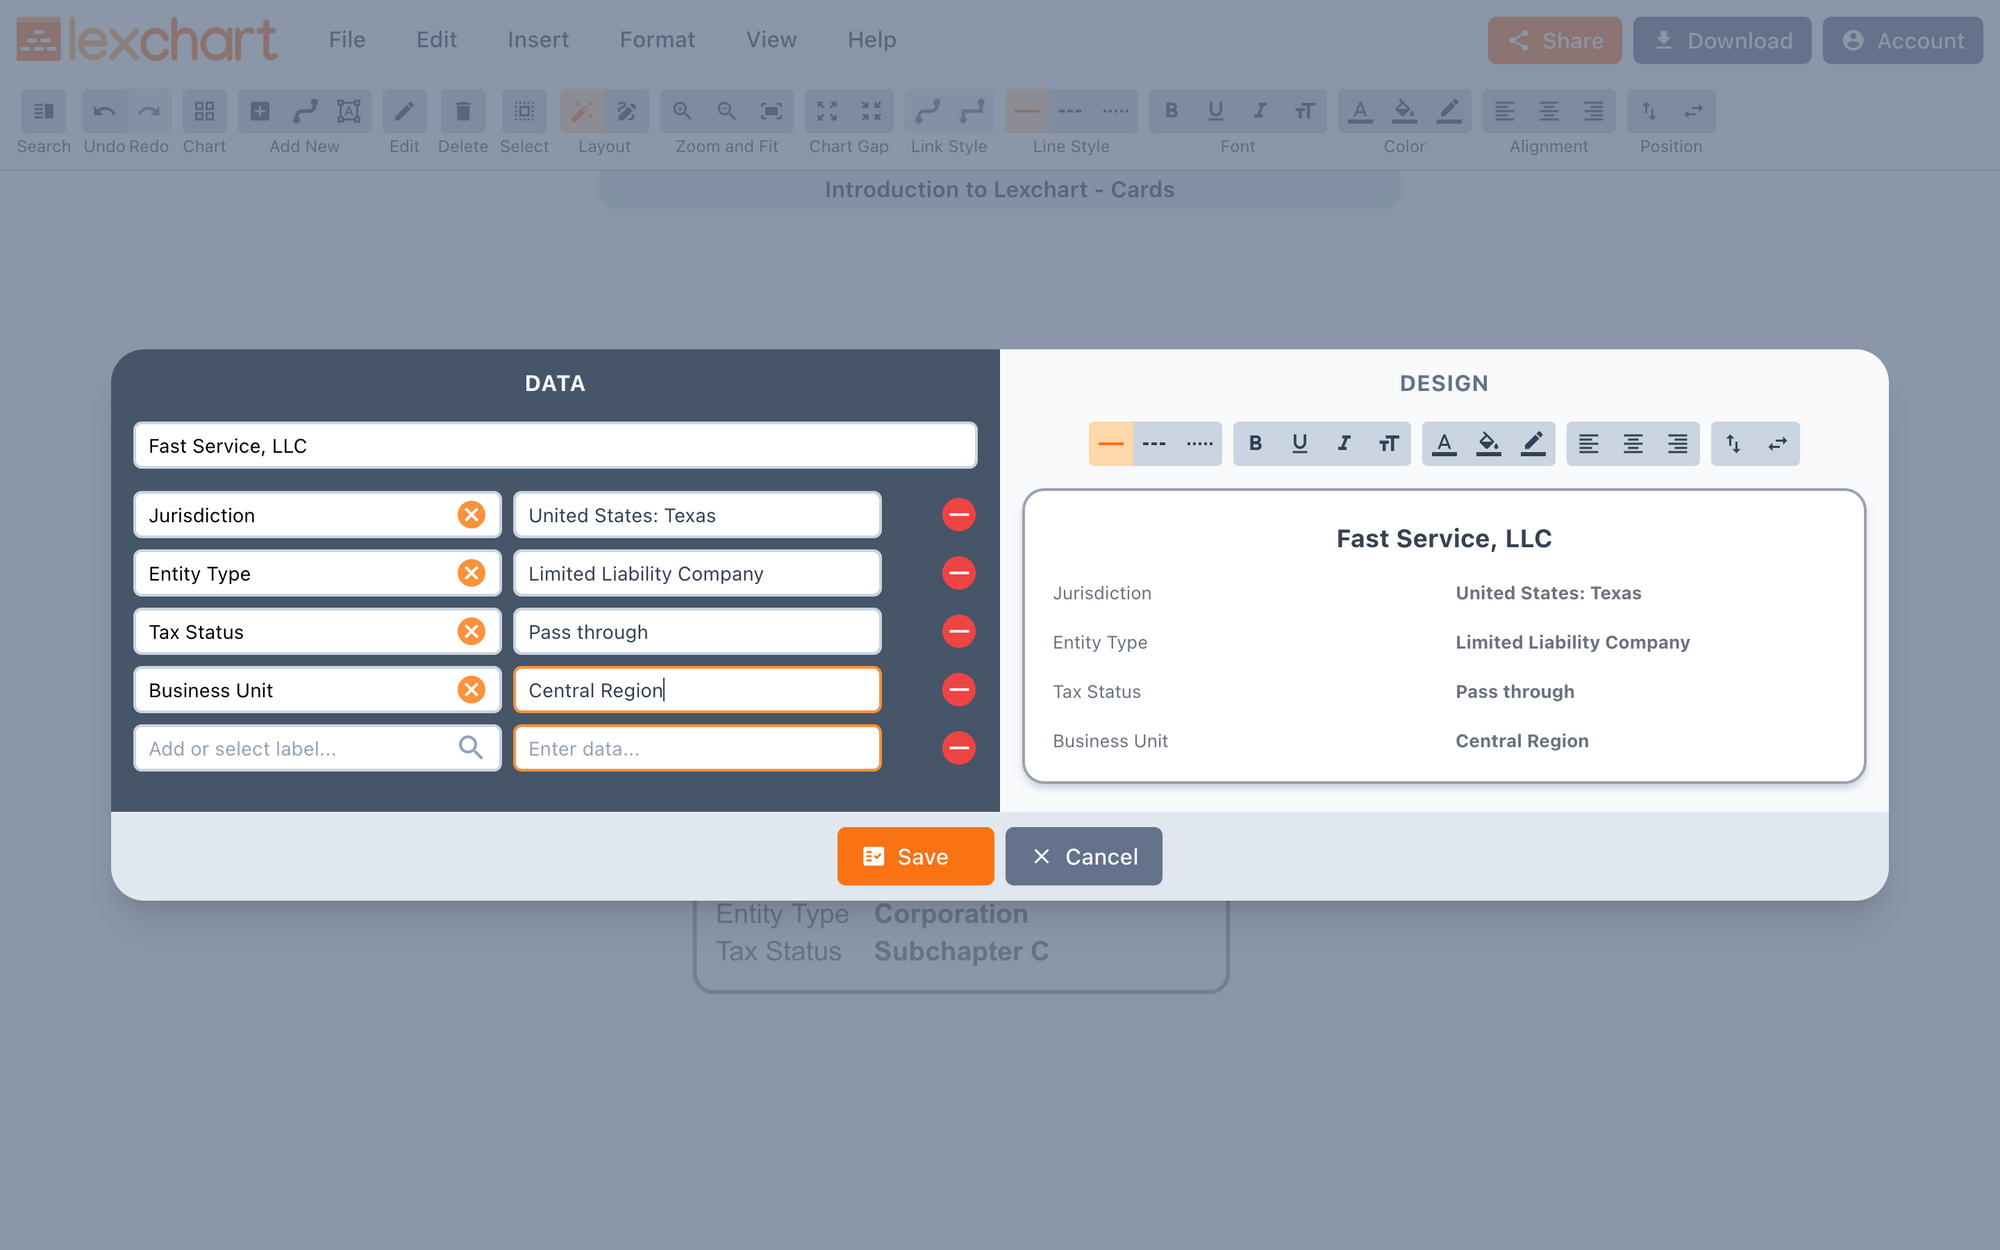
Notice how Fast Service, LLC has an additional label, "Business Unit", and data, "Central Region".
Design
The Design section of a card provides a visual appearance of the card. You can format each element of the card:
- border type (solid, dashed, or dotted) and color,
- font treatment (bold, italic, underline, and size) and font color,
- card fill color,
- text alignment (left, center, right), and
- label and data position.
There are two position options: Vertical and Horizontal. Position applies to labels and data in a card and to link notes. Vertical places the data label above the data. Select Vertical a second time to place the label below the data.
Horizontal position returns a Vertical position to side by side. Horizontal position reverses the label and data position when they are already side-by-side.
Link
A Link in Lexchart is the line between two cards. There are two things to know about a link: 1. the two cards have an immediate relationship, and 2. the two cards have an ordered relationship.
Lexchart will automatically display all the necessary entities and people more than one generation away from the two cards in question.
Each time you create a link, focus on cards which are immediately above or below each other.
Each link can contain information about itself in a Link note. Each link note can have unlimited labels and data.
Data
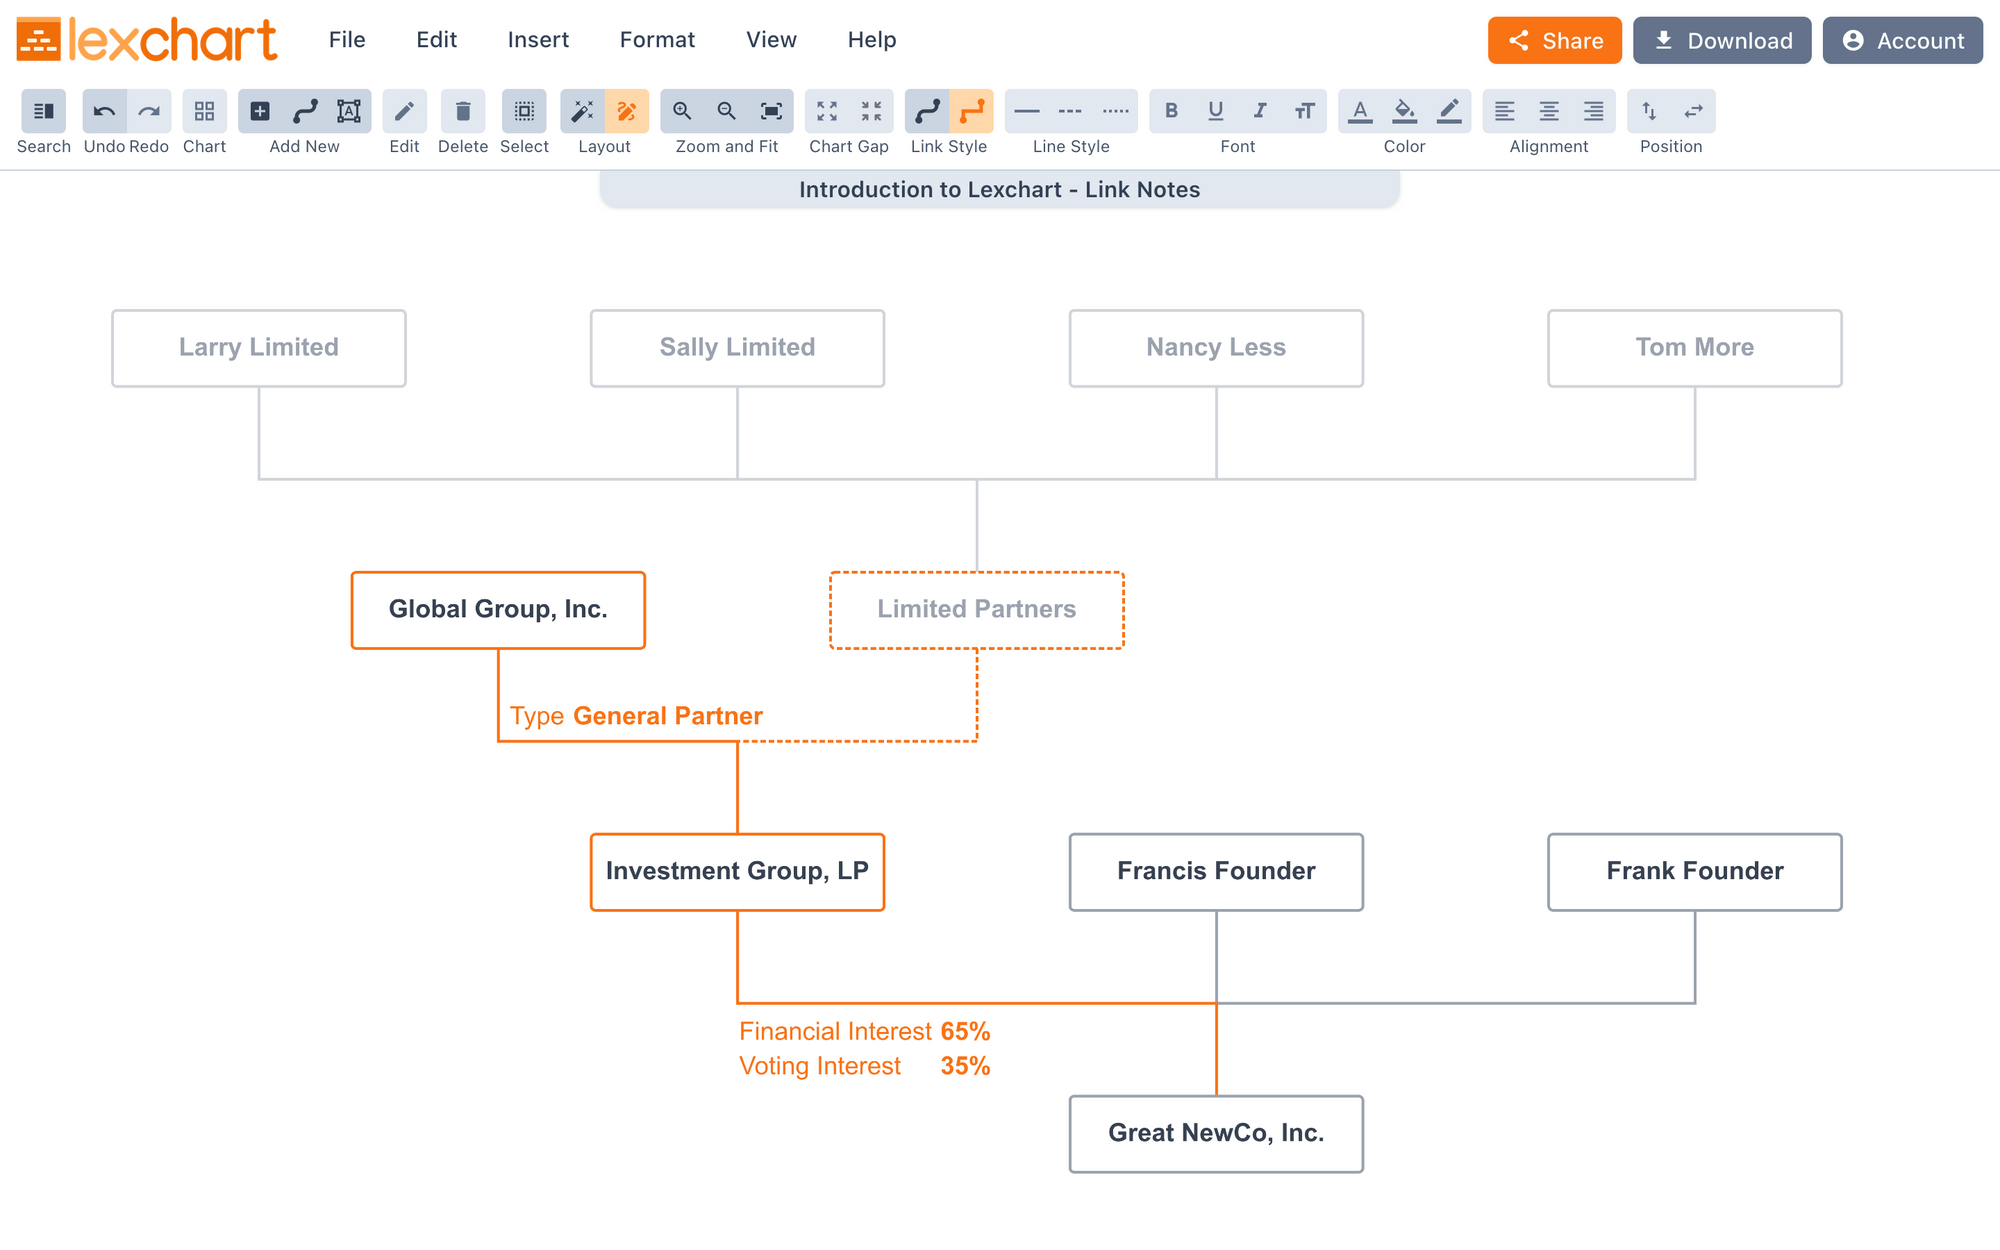
In this example, there is a link note on the line from Global Group, Inc. to Investment Group, LP. As an aside, you could include the General Partner information in the card itself.
There is a link note on the link from Investment Group, LP to Great NewCo, Inc. which establishes that Investment Group has a Financial Interest of 65% and a Voting Interest of 35%.
That is data which is specific to that relationship.
You add and edit link notes through the Link window.
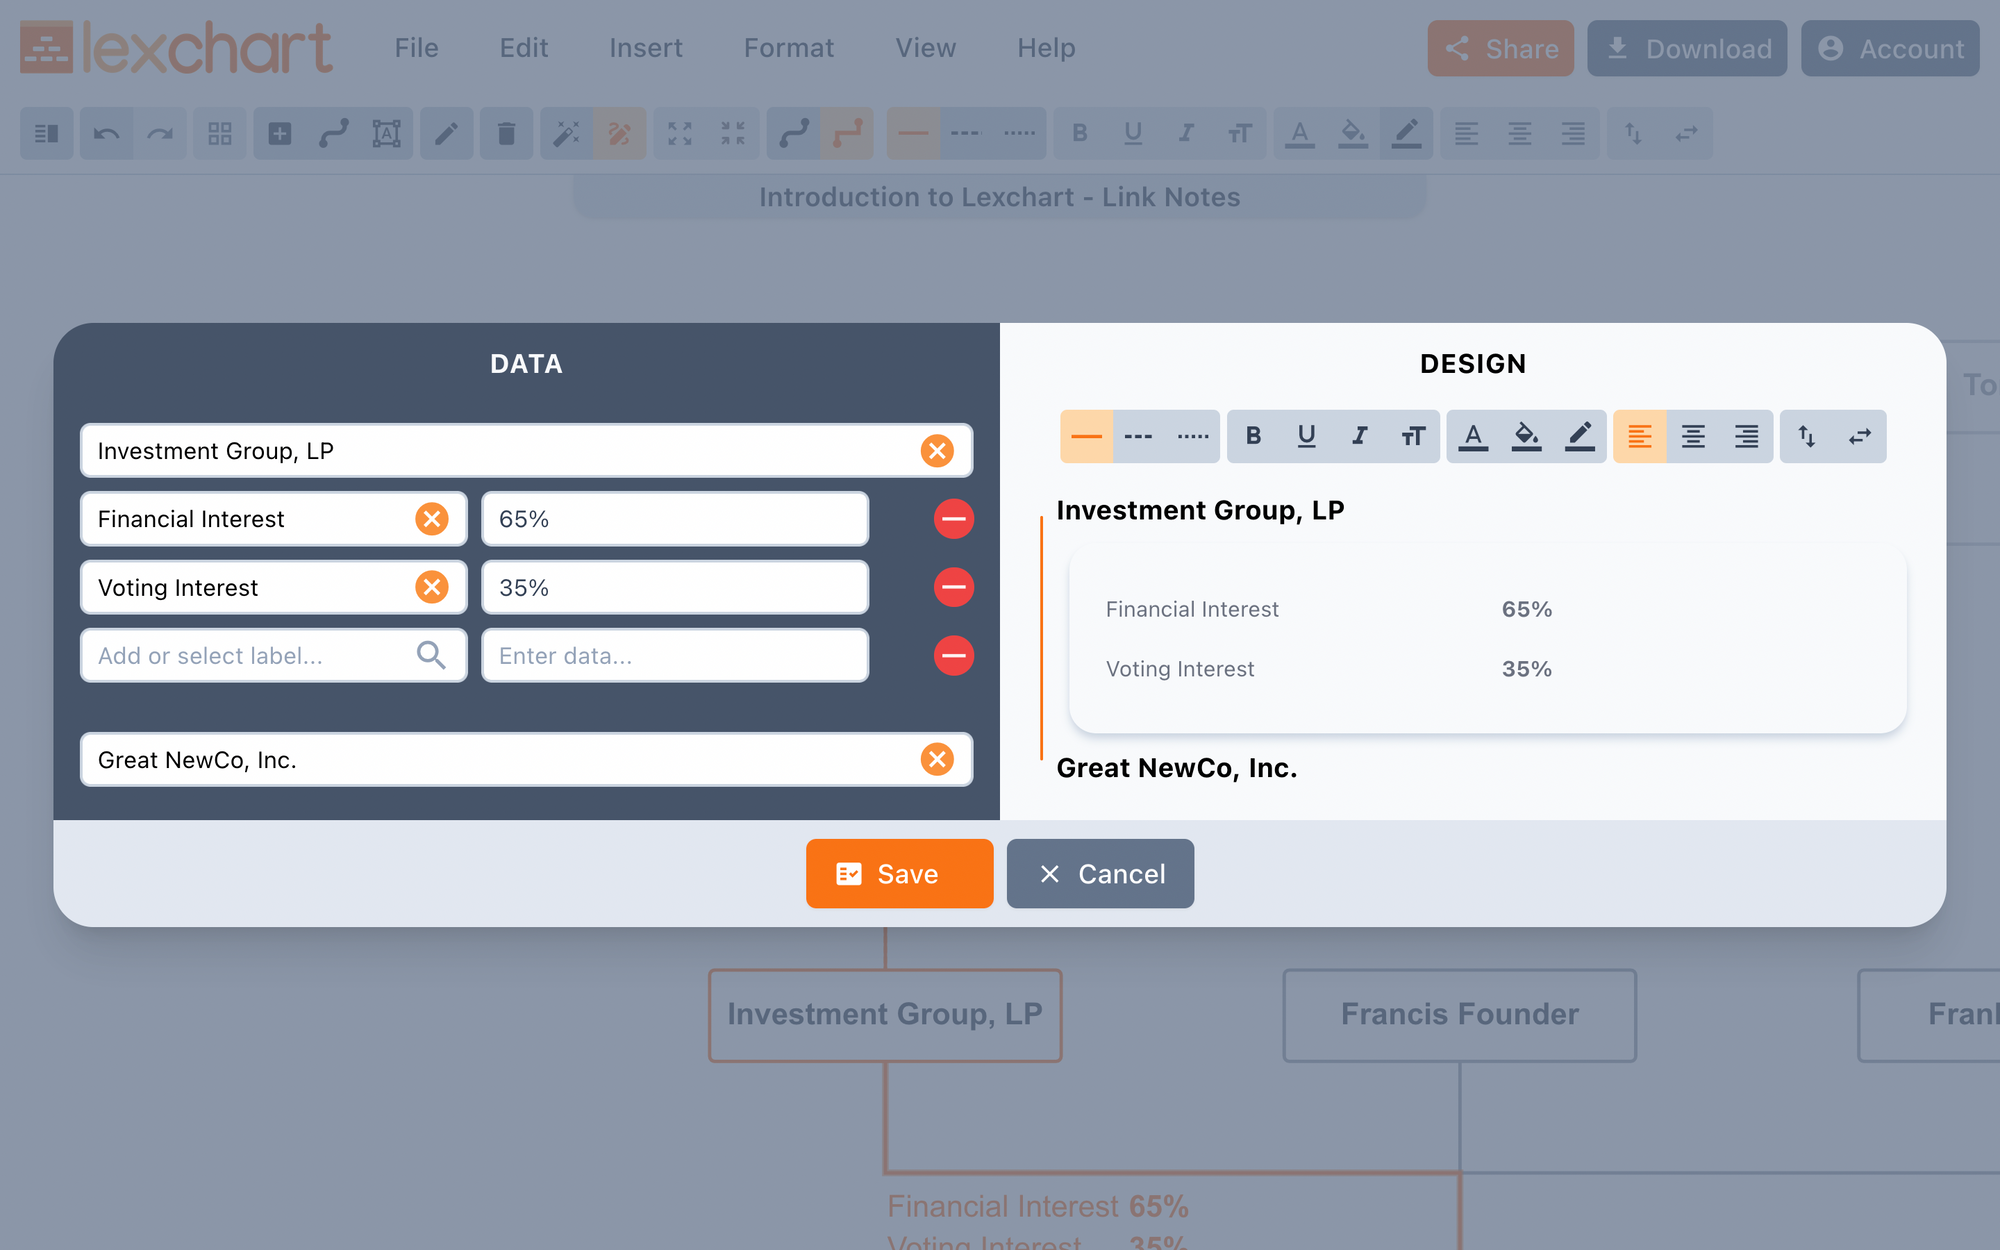
This is a window to control the data and design of the link.
Design
The Link window contains the same formatting features as the Card window. Use these tools to design the link note to your needs.
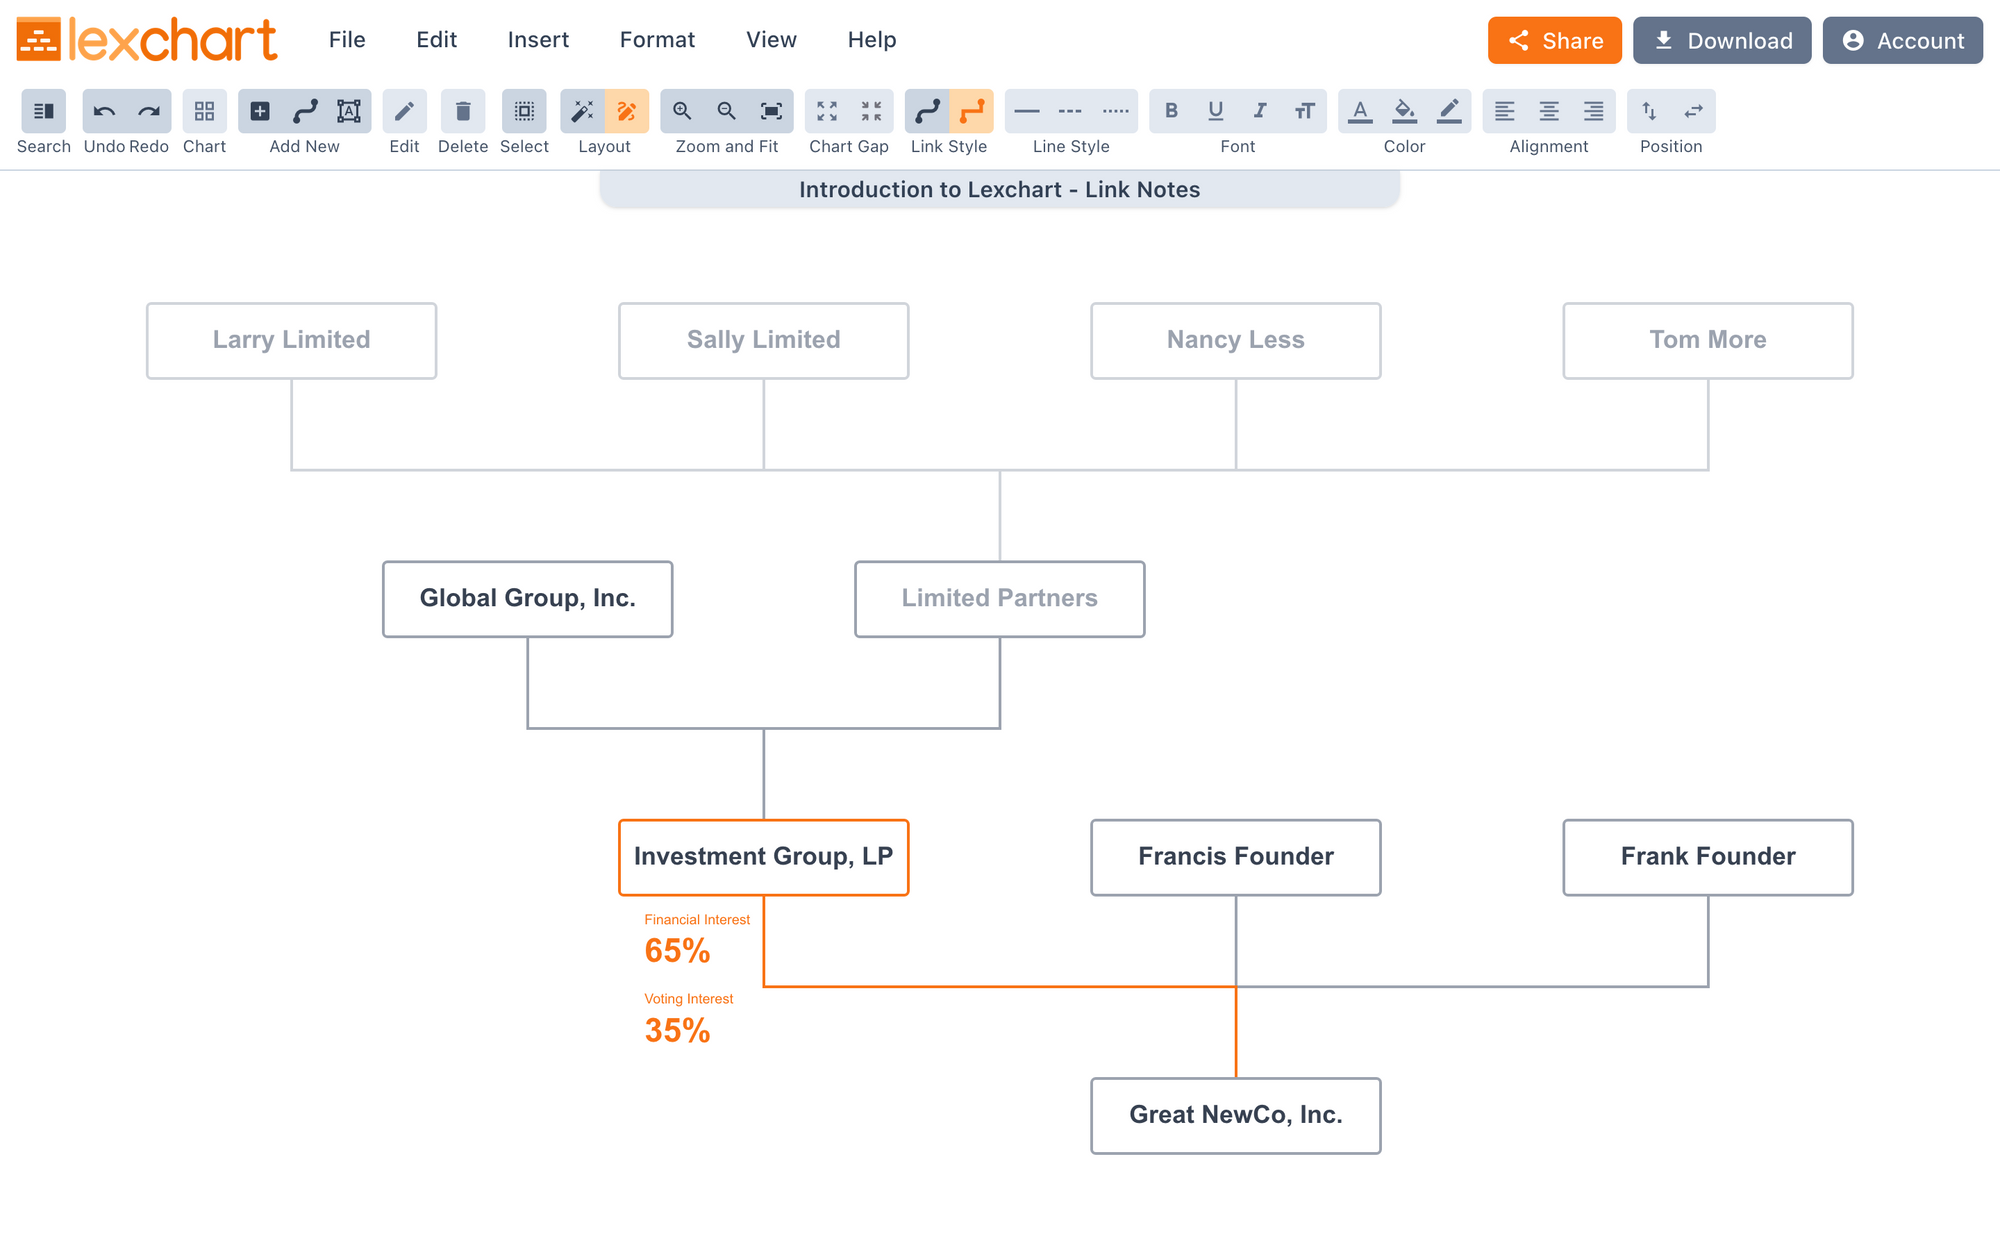
In this example, the link notes contain the following formatting changes:
- Position labels and data vertically with labels on top,
- Reduce label size to
XS(extra small), - Increase data size to
XL(extra large), - Set the label and data color to orange, and
- Set the link line color to orange.
Auto mode
Lexchart's Auto mode is a powerful helper. Auto mode lays out the chart based on the mathematics built at the foundation of Lexchart. Analyzes millions of possible layouts for your chart and selects one of the best.
Why "one of the best" and not "the best"? Some charts have a single best layout based on the math. Most charts, however, have several layouts which visually clear and accurate, but just different. Lexchart will select one of those.
Auto mode performs several design tasks for you:
- Create vertical layers ("generations") for vertical spacing,
- Place cards (companies or people) on the correct vertical level given all of the links (ownership or management relationships),
- Cluster cards horizontally based on vertical relationships throughout the chart,
- Support unlimited cards on any level,
- Support unlimited links between cards, and
- Support links that "skip generations."
You can switch from Auto mode to Manual mode.
Manual mode
In Manual mode, you can move cards anywhere on the canvas. Lexchart preserves the link lines in Manual mode. You can move the lines.
Move cards
Select and drag a card to move it. You can disregard the hierarchy of the chart as you move the card.
To move several cards as a group, select the cards you want to move (CTRL + Select on Windows; CMD + Select on macOS). Drag the selected group of cards.
Move lines
To move a link line in manual mode, select the line. Hover over the line until the cursor icon changes. You can now drag the line.
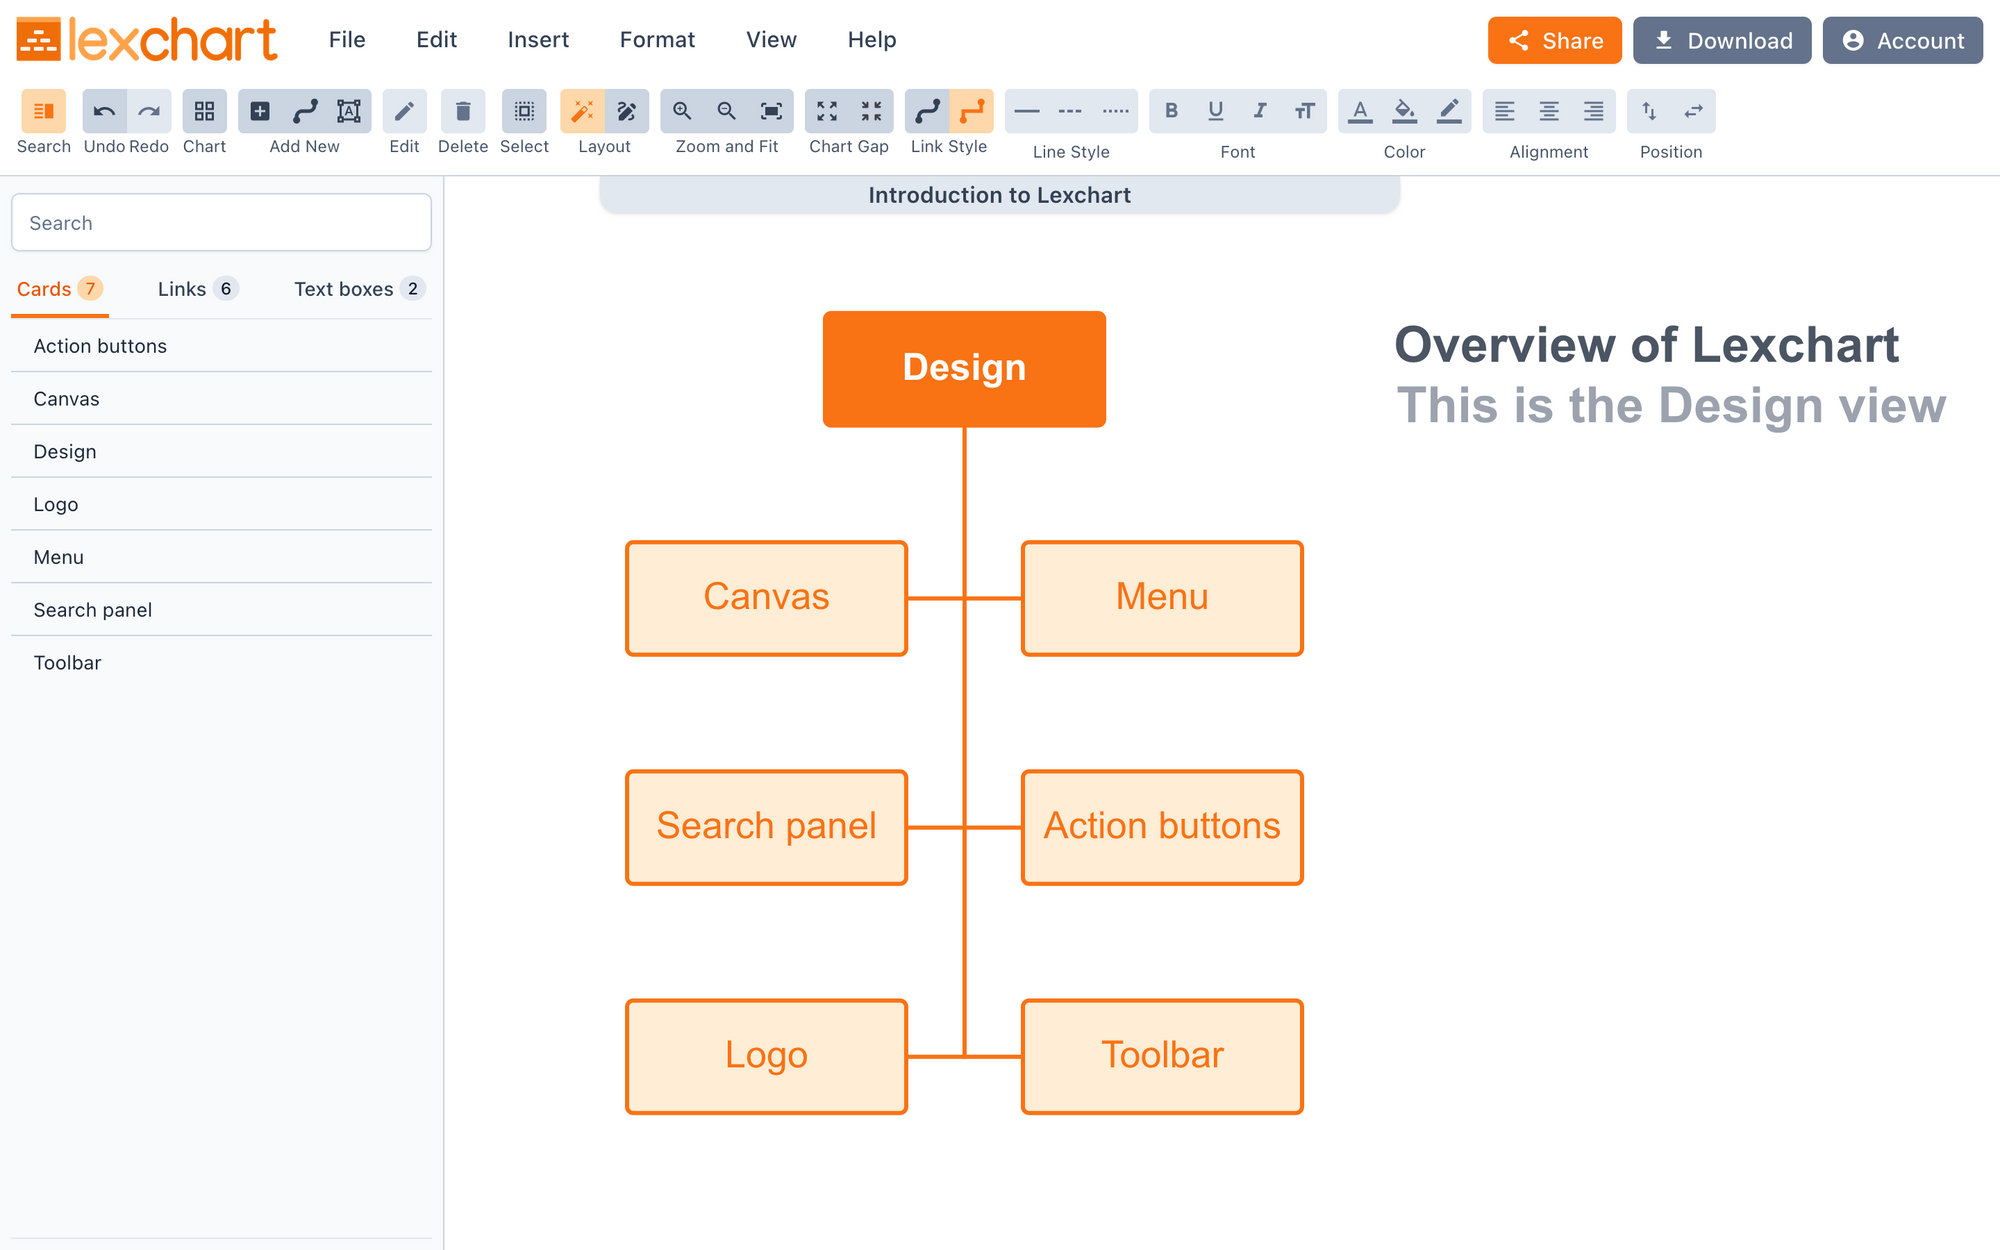
Designer
The Lexchart Designer is where you create your chart.
Access the Designer from your chart collection or start a new chart.
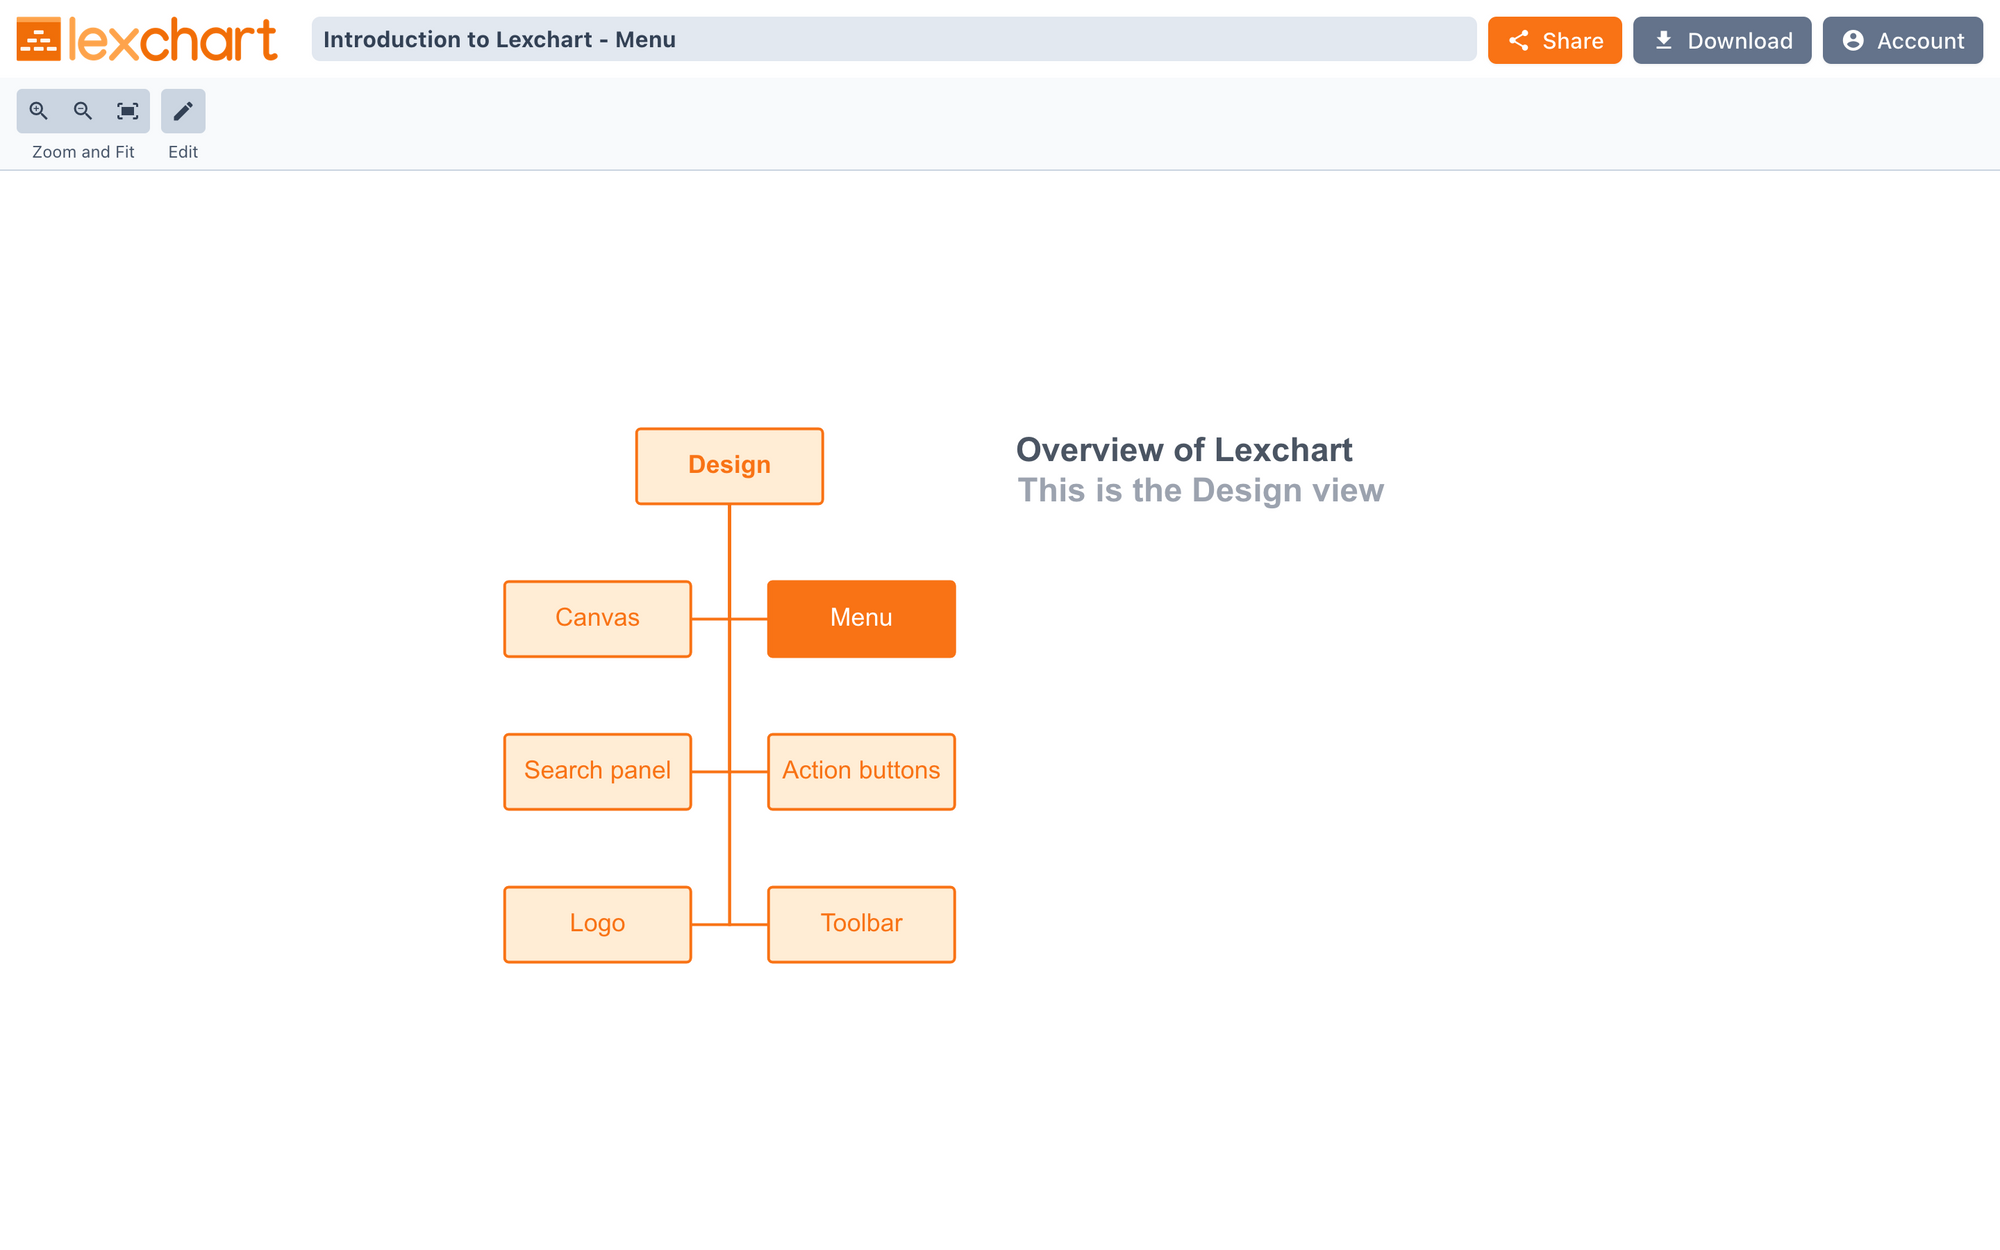
Viewer
The Viewer is the presentation view of a chart.
Share charts
You can share charts with your colleagues in Lexchart. From the Designer or Viewer, choose Share to access the options for sharing a chart.
A user who is a Viewer can see the chart in the Viewer, but cannot edit the chart in the Designer.
An Editor can use the Designer to modify the chart.
A Co-Owner has the rights of an Editor. A Co-Owner can change sharing settings and delete a chart for other users.